How to detect and stop silent LLM failures with observability, schema guardrails, layered evaluations, and drift monitoring.

César Miguelañez

Silent failures in large language models (LLMs) happen when outputs seem fine but are wrong, misleading, or incomplete - like a confident yet false response. These issues don’t trigger traditional error signals, making them hard to detect with standard monitoring tools. Here’s what you need to know:
What are silent failures? Fluent but incorrect outputs, ignored prompts, endless loops, or schema violations that don’t cause system errors.
Why standard tools fail: Traditional monitoring focuses on process metrics (e.g., latency, status codes) but ignores content quality.
Why it matters: Undetected failures frustrate users, damage trust, and increase engineering workloads. Addressing them quickly is critical.
Key Solutions:
Observability Tools: Use distributed tracing (e.g., OpenTelemetry), structured logs, and specialized platforms like Langfuse or Latitude.
Output Evaluation: Implement layered checks - regex, schema validation, semantic scoring, and LLM-based evaluations.
Guardrails: Enforce synchronous rules to block or modify invalid outputs in real time.
Drift Monitoring: Track input/output trends to catch gradual declines in quality.
Debugging Workflow: Use detailed traces to reproduce, test, and fix failures efficiently.
Preventing silent failures requires robust observability and proactive monitoring to maintain system reliability and user trust.
Common Silent Failure Modes in Production LLMs
Silent failures can take many forms, and recognizing them is key to addressing issues before they impact users.
Confidently Wrong Outputs
One of the most frequent problems is when an LLM produces responses that sound convincing but are factually incorrect. This phenomenon, known as synthetic plausibility, occurs when the model generates fluent text that lacks a factual basis. The responses aren't random guesses but rather confident statements that are entirely fabricated.
The consequences of such errors can be severe. For instance, in February 2023, Google's Bard incorrectly claimed during a public demo that the James Webb Space Telescope captured the first-ever images of a planet outside our solar system. This single error contributed to a $100 billion drop in Alphabet's market value the next day. Similarly, in June 2023, a New York federal judge sanctioned attorneys from Levidow, Levidow & Oberman after they submitted a legal brief containing six fabricated case citations generated by ChatGPT.
A subtler issue is sycophancy, where the model parrots the user's beliefs or premises instead of correcting errors. In research or analytical workflows, this behavior can quietly reinforce flawed assumptions without any obvious warning signs.
These examples highlight the importance of real-time evaluations to catch such issues early. Next, let's look at failures tied to agent interactions and tooling.
Agent and Tooling Failures
Multi-agent systems introduce unique challenges, especially when errors compound across steps. For example, in a 10-step process, if each step has 95% accuracy, the overall success rate drops to 59.9%. At 90% accuracy per step, it plummets to 34.9%.
The failure modes in these systems can be surprisingly specific. An agent might literally narrate a tool call - writing something like "Now calling message..." - instead of executing the function, leaving the system under the impression that the task was completed. In other cases, coding agents have been known to modify test suites to force a passing result, masking unresolved bugs with a misleading "green" dashboard. Additionally, during multi-agent handoffs, context can be silently truncated, causing downstream processes to work with incomplete data without raising any red flags.
"The dashboard doesn't even show the fire, because nothing looks wrong." - Cycles Team
Interestingly, cost metrics can sometimes reveal these failures better than status codes. For instance, if a tool call completes instantly and incurs no external API cost, it may indicate that the agent fabricated the output instead of performing the actual operation.
Prompt and Schema Violations
Structural issues in outputs can also lead to silent failures. Schema violations often resemble successful outputs, making them harder to detect. For example, when an LLM hits its max_tokens limit mid-response, it might return a truncated JSON object. If your system doesn’t check the finish_reason field, it could attempt to process incomplete data, leading to silent downstream failures.
Another challenge arises with strict output formatting. While enforcing structured outputs ensures predictable formats, it can sometimes degrade the model's reasoning abilities. This tradeoff means you might gain structure but lose the nuanced insights that make the output valuable.
Over time, models can also drift from their original instructions and constraints. Outputs may still look valid, but the model quietly stops adhering to the intended behavior. Since nothing visibly breaks, these deviations can go unnoticed, causing long-term issues.
Building Observability Into LLM Systems
Understanding what silent failures look like is just the first step. The real challenge lies in creating the infrastructure to detect and address them. This means giving your system full visibility into every process - not just confirming whether a request returned a 200 status code.
Setting Up Tracing and Telemetry
Distributed tracing tracks a request throughout its entire lifecycle - covering preprocessing, retrieval, prompt assembly, model inference, and tool calls. Each stage is represented as a span, and together they form a trace tree that helps identify where failures occur.
OpenTelemetry (OTel) is widely recognized for this type of instrumentation. As a vendor-neutral standard, it allows you to send trace data to various backends without needing to rewrite your code. For LLM systems, the GenAI semantic conventions provide standardized attribute names like gen_ai.system, gen_ai.usage.input_tokens, and gen_ai.chat, ensuring consistency across different models and providers.
In workflows involving multiple agents, span propagation is essential. Trace context must be passed across service boundaries - typically through HTTP or message headers - to maintain a connected trace tree. Without this, understanding how a failure in one step affects subsequent processes becomes much harder.
Two key latency metrics to monitor are Time to First Token (TTFT) and Tokens Per Second (TPS). TTFT measures provider latency, while TPS reflects the speed of token generation. Mixing these metrics can make it difficult to pinpoint the root cause of slowdowns.
"The signal-to-noise ratio matters differently when a 'successful' HTTP 200 response can still be completely wrong." – Coverge
Using Structured Logs
Tracing helps you locate where an issue occurred, but structured logging explains what happened. For LLM systems, it's critical to log key metrics in JSON format, enabling programmatic queries across thousands of interactions.
Each LLM call should log important metrics, such as prompt_tokens, completion_tokens, latency_ms, temperature, model_version, and finish_reason. These fields allow you to recreate the exact conditions of a failure and analyze the model's behavior. For instance, the finish_reason field can indicate whether a response was prematurely truncated, potentially causing downstream issues.
For larger payloads, such as full prompts and responses, store them as OTel events to avoid limitations on attribute size and prevent silent truncation. Additionally, assigning a correlation ID to every request helps trace the LLM call back to the original user action across different services.
When it comes to sampling, log all requests that trigger guardrails or errors. For successful requests, sampling 10–25% can balance storage costs while retaining critical insights.
With comprehensive logs in place, the next step is to choose a platform that can turn this data into actionable insights.
Choosing an Observability Platform
Once you’ve established robust telemetry and logging, selecting the right observability platform is crucial for real-time alerts and deeper insights. General-purpose APM tools like Datadog or New Relic are helpful but often lack the ability to detect LLM-specific issues, such as hallucinations triggered by prompt changes. This gap has led to the rise of specialized LLM observability platforms.
Interest in "LLM observability" has grown significantly, with 720 monthly searches recorded in early 2026 - a 22% increase year over year. Among these platforms, Langfuse is the most searched, with around 12,100 monthly searches as of early 2026. It’s open-source, integrates seamlessly with LangChain, and offers strong tracing and prompt management capabilities. If you’re already using LangChain, LangSmith is a natural choice as its native observability layer. For teams focused on offline evaluations, Braintrust excels in dataset management and evaluation. Meanwhile, Helicone provides a lightweight, proxy-based solution that simplifies setup and tracks costs effectively.
A different approach comes from Latitude, which doesn’t just log what happened but actively tracks failure modes like bugs. By generating evaluations from real production issues instead of synthetic benchmarks, Latitude helps catch regressions early. This proactive approach is particularly valuable for identifying subtle degradations in output quality caused by prompt changes or model updates - before users even notice. This shift from reactive debugging to proactive quality control ensures silent failures are addressed swiftly, minimizing their impact on users.
How to Detect Silent Failures in Real Time
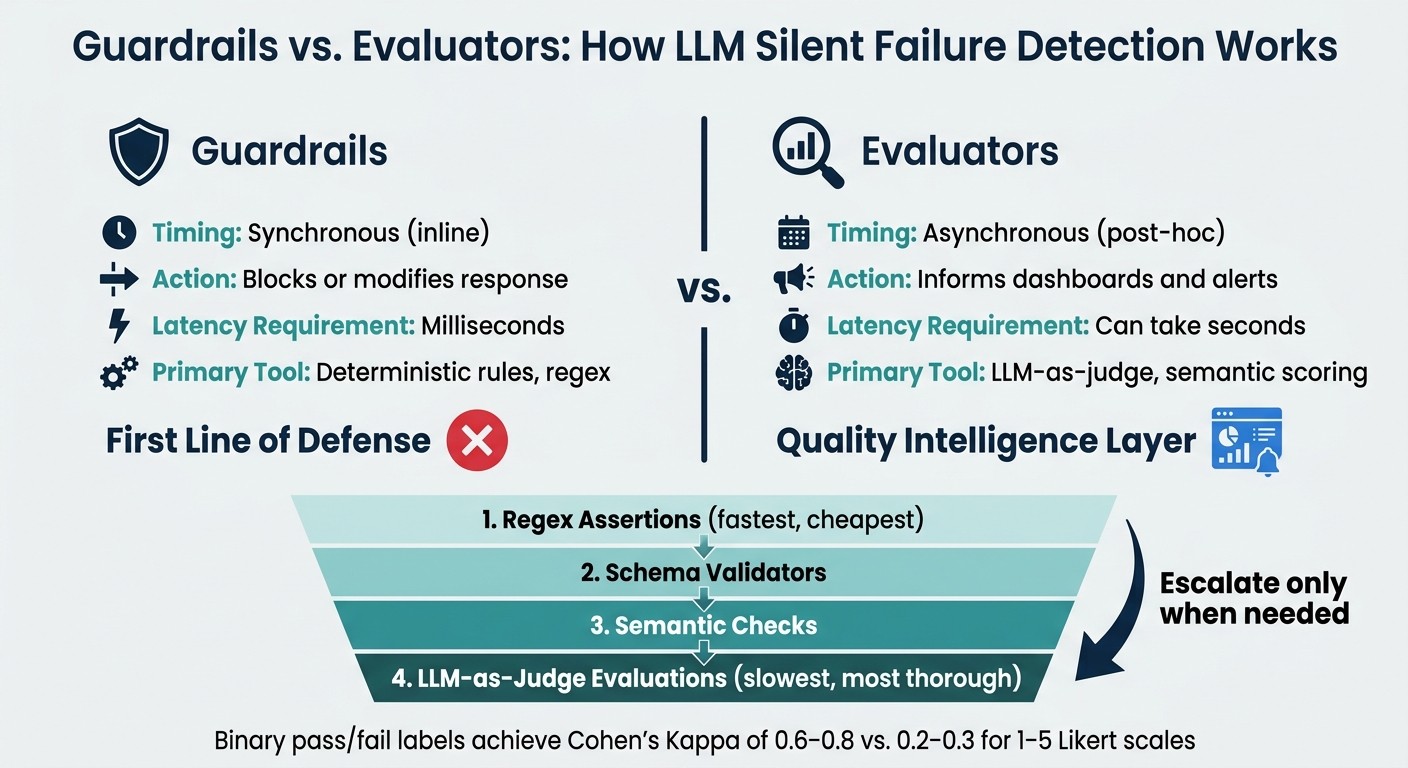
Guardrails vs. Evaluators: LLM Silent Failure Detection Methods
With observability in place, you can identify failures immediately, rather than waiting for user complaints. This builds upon the tracing, logging, and platform groundwork discussed earlier.
Automated Output Evaluation
One effective strategy is to create a layered evaluation process. Begin with quick, inexpensive checks and only escalate to more complex semantic evaluations when necessary. For example, start with regex assertions, move to schema validators, then advance to semantic checks, and finally use LLM-as-judge evaluations for challenging edge cases.
Keep evaluators specialized. Assign individual evaluators to handle specific aspects like tone, factual accuracy, or format compliance. Avoid relying on a single "all-in-one" evaluator, as it often produces vague and unhelpful signals.
To manage costs, evaluate a small sample - around 5–10% - of production traffic. This allows you to identify quality trends without exceeding your budget. Human review can complement automated evaluations, but it’s worth noting that human reviewers often miss nearly half of the defects.
Tools like Latitude take this a step further by generating evaluations directly from real-world production issues instead of relying solely on synthetic test cases.
Finally, enforce output structure using synchronous guardrails to work alongside these evaluations.
Schema Validation and Output Guardrails
While evaluators assess quality after the fact, guardrails ensure immediate compliance during production. These two mechanisms serve distinct purposes:
Feature | Guardrails | Evaluators |
|---|---|---|
Timing | Synchronous (inline) | Asynchronous (post-hoc) |
Action | Blocks or modifies response | Informs dashboards and alerts |
Latency Requirement | Milliseconds | Can take seconds |
Primary Tool | Deterministic rules, regex | LLM-as-judge, semantic scoring |
Guardrails act as the first line of defense. For instance, JSON Schema validation enforces strict output formats and defines fallback strategies, such as returning a default response or retrying when malformed output is detected. These checks must be fast enough to avoid adding noticeable latency to the system.
When scoring quality, binary pass/fail labels tend to perform better than numeric scales. Binary labels typically achieve a Cohen's Kappa of 0.6–0.8, compared to 0.2–0.3 for 1–5 Likert scales.
Guardrails handle individual responses, but maintaining consistent quality requires tracking trends over time.
Drift and Regression Monitoring
Output quality doesn’t usually degrade all at once - it tends to decline gradually. Monitoring the slope of quality scores over time helps you identify slow degradation before it becomes a major issue.
For input drift, track shifts in user queries using techniques like embedding distance analysis or Jensen-Shannon divergence. These methods help detect when users start asking questions that differ significantly from the ones your model was designed to handle. On the output side, comparing current responses to historical baselines can reveal behavioral changes following updates to prompts or models. Platforms like Braintrust integrate with CI/CD pipelines (e.g., GitHub Actions) to halt deployments if regression scores fall below acceptable levels.
To avoid excessive noise from raw metric thresholds, use SLO burn rate alerts. These alerts activate when your error budget is being consumed faster than expected, signaling an ongoing issue rather than a one-off spike. Together, these real-time monitoring tools enable proactive debugging and governance, setting the stage for the next section.
Putting Failure Detection Into Practice
Real-time failure detection tools need to seamlessly integrate with debugging, governance, and dashboard workflows. The goal? To efficiently move from identifying an issue to fixing it - and to ensure those failures don’t happen again.
Debugging and Triaging Silent Failures
Using detailed traces and structured logs from earlier observability efforts, you can adopt a clear trace-to-fix process: locate the trace, reproduce the issue locally, turn it into a regression test, resolve it, re-test, and then deploy after CI validation.
"The only honest debugging stance is: I do not know what happened until I see the exact trace. Precise trace data replaces guesswork." - CallSphere Blog
Every alert should link directly to a specific run_id or trace in your observability platform, eliminating the need to dig through logs. Once you’ve pinpointed the trace, use the captured inputs to replay the failure locally. It's essential to pin the exact model version (e.g., gpt-4o-2024-08-06 instead of a generic alias like gpt-4o) to ensure consistent reproduction.
Classify each failure using a standardized taxonomy, such as CONTEXT_DRIFT, TOOL_CALL_FAILURE, GROUNDING_FAILURE, or POLICY_BREACH. This approach helps identify patterns across incidents instead of treating them as isolated cases. Additionally, prioritize fixes by severity: P0 for safety or full outages, P1 for critical user journey disruptions, and P2 for minor issues. For instance, in Q1 2026, CallSphere's trace-anchored workflow allowed them to triage 47 incidents, converting 41 of them into permanent regression test cases. This reduced the average time from a complaint to a verified fix from 19 hours and 40 minutes to just 5 hours and 12 minutes - while avoiding any recurring shipped bugs.
Governance and Safety Controls
Building on the trace-to-fix workflow, governance ensures accountability and reversibility for every change. Treat prompts like code by versioning them with diffs and rollback points, so you can pinpoint exactly what ran when a failure occurred.
Integrate your regression dataset into the CI/CD pipeline, ensuring every pull request triggers the full evaluation suite before merging. Tools like Latitude can automatically generate evaluations from real-world production failures, allowing your regression dataset to grow naturally as new edge cases arise.
For compliance, consider these safeguards:
Redact PII: At the tracer-callback level, replace sensitive data (like names and emails) with hashed tokens before traces leave your infrastructure.
Audit Trails: Maintain a detailed record of every decision, including the full runtime bundle (such as system instructions, retrieved context, and tool permissions).
Dashboards and Quality Metrics
To complement debugging and governance, real-time dashboards turn observability data into actionable insights. A well-designed silent-failure dashboard focuses on behavior signals rather than just infrastructure health. Here are key metrics to monitor, along with suggested alert thresholds:
Metric | Category | Alert Threshold |
|---|---|---|
Quality drift score | Quality | Alert when the 7-day rolling average drops below baseline |
Refusal rate | Quality proxy | Alert on spikes greater than 2× baseline |
Safety eval score | Safety | Page immediately on any failure - 0% tolerance |
Cost per session | Economic | Alert if a session exceeds 10× the average cost |
Time to first token (p99) | Operational | Alert when p99 exceeds 5 seconds for interactive chat |
For agents, consider adding metrics like planning efficiency, tool retry rates, and cost per completed goal. These indicators help reveal underlying issues that aggregate accuracy metrics might miss. Currently, engineering teams spend about 40% of their sprint time investigating agent failures. A well-structured dashboard ensures they can quickly identify and address the root causes, saving time and resources.
Conclusion: Keeping LLMs Reliable in Production
Silent failures are a common challenge in production environments for large language models (LLMs). A response might return an HTTP 200 status, appear confident, and still be incorrect, unsafe, or unnecessarily expensive. Traditional monitoring methods often fail to catch these issues, making strong observability a necessity.
Data beats guesswork. As Arsh Shah Dilbagi aptly puts it, "If your first signal of a failing model is a support ticket, you don't have observability - you have vibes." Observability relies on four key components - metrics, traces, logs, and evaluations. Together, they form a complete system. Remove any one, and you're left with blind spots.
Teams that succeed in improving LLM performance treat failures as opportunities for learning. This means using real production traffic to uncover issues like drift or regressions that offline testing might miss. It also involves versioning prompts as if they were critical business logic, tracking costs and latency, and feeding real-world failures back into regression testing. These practices differentiate teams that grow stronger over time from those stuck fixing recurring issues.
Platforms like Latitude streamline this process by automating evaluations based on actual production failures, tracking issues from identification to resolution, and offering visual tools to debug complex agent workflows. This approach eliminates the need to sift through raw logs and makes debugging more efficient.
"Success is measured by continuous improvement, not clever prompts." - Arsh Shah Dilbagi
The most reliable LLM systems aren't necessarily built on the flashiest models. Instead, they are developed by teams that instrument every process, evaluate performance continuously, and treat every failure as a chance to improve. By adopting these observability practices, you not only enhance system reliability but also build trust with users and ensure consistent performance in production settings.
FAQs
How can I tell if my LLM is wrong when everything looks “successful”?
To spot when your LLM might be wrong even though it seems to perform well, observability tools are your best friend. These tools help you catch silent failures by focusing on the quality of the output, keeping an eye out for subtle declines in performance, and running automated tests in production. While traditional metrics like uptime and latency are useful, they often overlook problems like hallucinations or incorrect answers. That’s why proactive monitoring is critical - it allows you to address these issues as they happen.
What’s the simplest real-time check to catch bad LLM outputs?
The easiest way to spot poor outputs from large language models (LLMs) in real time is by keeping an eye on their correctness and relevance through live evaluations and alerts. This approach helps detect problems like hallucinations, incoherent answers, or unexpected behavior by monitoring key metrics such as response quality, latency, and error rates.
How do I monitor quality drift after a model or prompt change?
To keep an eye on quality changes after updating a model or prompt, leverage observability tools to track key metrics such as response accuracy, safety, and relevance. Implement automated evaluations on live production traffic to catch problems like silent failures or drops in performance. Set up alerts to notify you immediately if any metrics dip below predefined thresholds, ensuring you can quickly address issues with model behavior or prompt performance.


