

Scalability in large language model (LLM) pipelines is about managing high traffic while keeping costs low, response times fast, and outputs accurate. This guide compares five tools for evaluating LLM performance in production: Latitude, LangSmith, Langfuse, Helicone, and Braintrust. Each focuses on metrics like throughput, latency, reliability, and cost per request but offers unique features based on your needs:
-
Latitude : Automates evaluations from production issues, reducing manual effort and improving prompt accuracy.
-
LangSmith : Optimized for LangChain workflows, offering fast trace queries but higher costs at scale.
-
Langfuse : Open-source and self-hostable, designed for high-volume pipelines with advanced analytics.
-
Helicone : Simplifies setup with a proxy model, cutting API costs through caching.
-
Braintrust : Integrates evaluations into CI/CD pipelines, blocking deployments on score regressions.
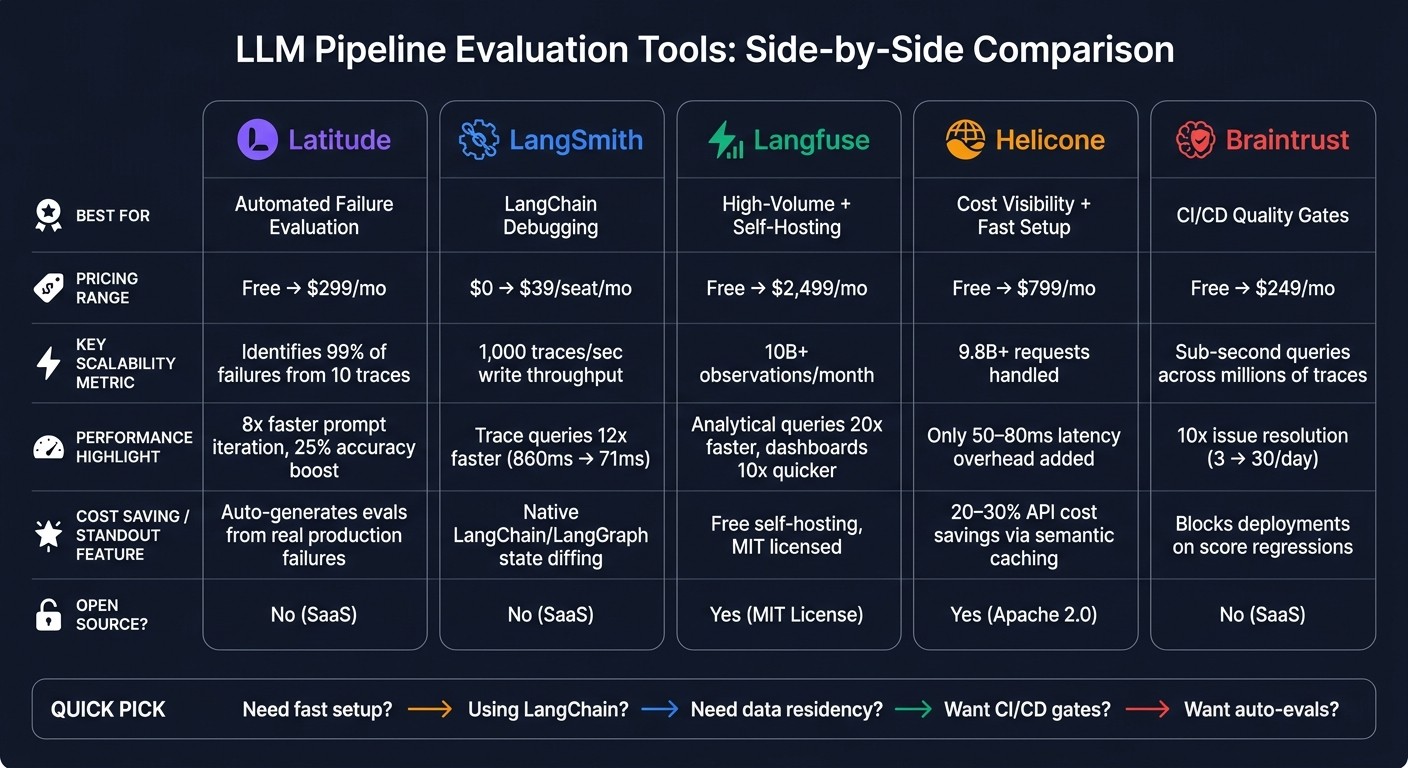
Quick Tip : Your choice depends on traffic volume, budget, and the level of insight needed into your pipeline. Below is a comparison table summarizing the platforms.
| Platform | Best For | Pricing Highlights | Key Features |
|---|---|---|---|
| Latitude | Automated failure evaluation | Free to $299/month | Observability with auto evaluations |
| LangSmith | LangChain debugging | $0 to $39/seat/month | Fast trace queries, LangChain integration |
| Langfuse | High-volume + self-hosting | Free to $2,499/month | Open source, scalable analytics |
| Helicone | Cost visibility + fast setup | Free to $799/month | Proxy-based routing, cost-saving caching |
| Braintrust | CI/CD quality gates | Free to $249/month | Asynchronous scoring, sub-second trace queries |
This article dives deeper into each platform’s features, pricing, and scalability options to help you make the right choice for your LLM pipeline.
LLM Pipeline Evaluation Tools Compared: Features, Pricing & Scalability
1. Latitude
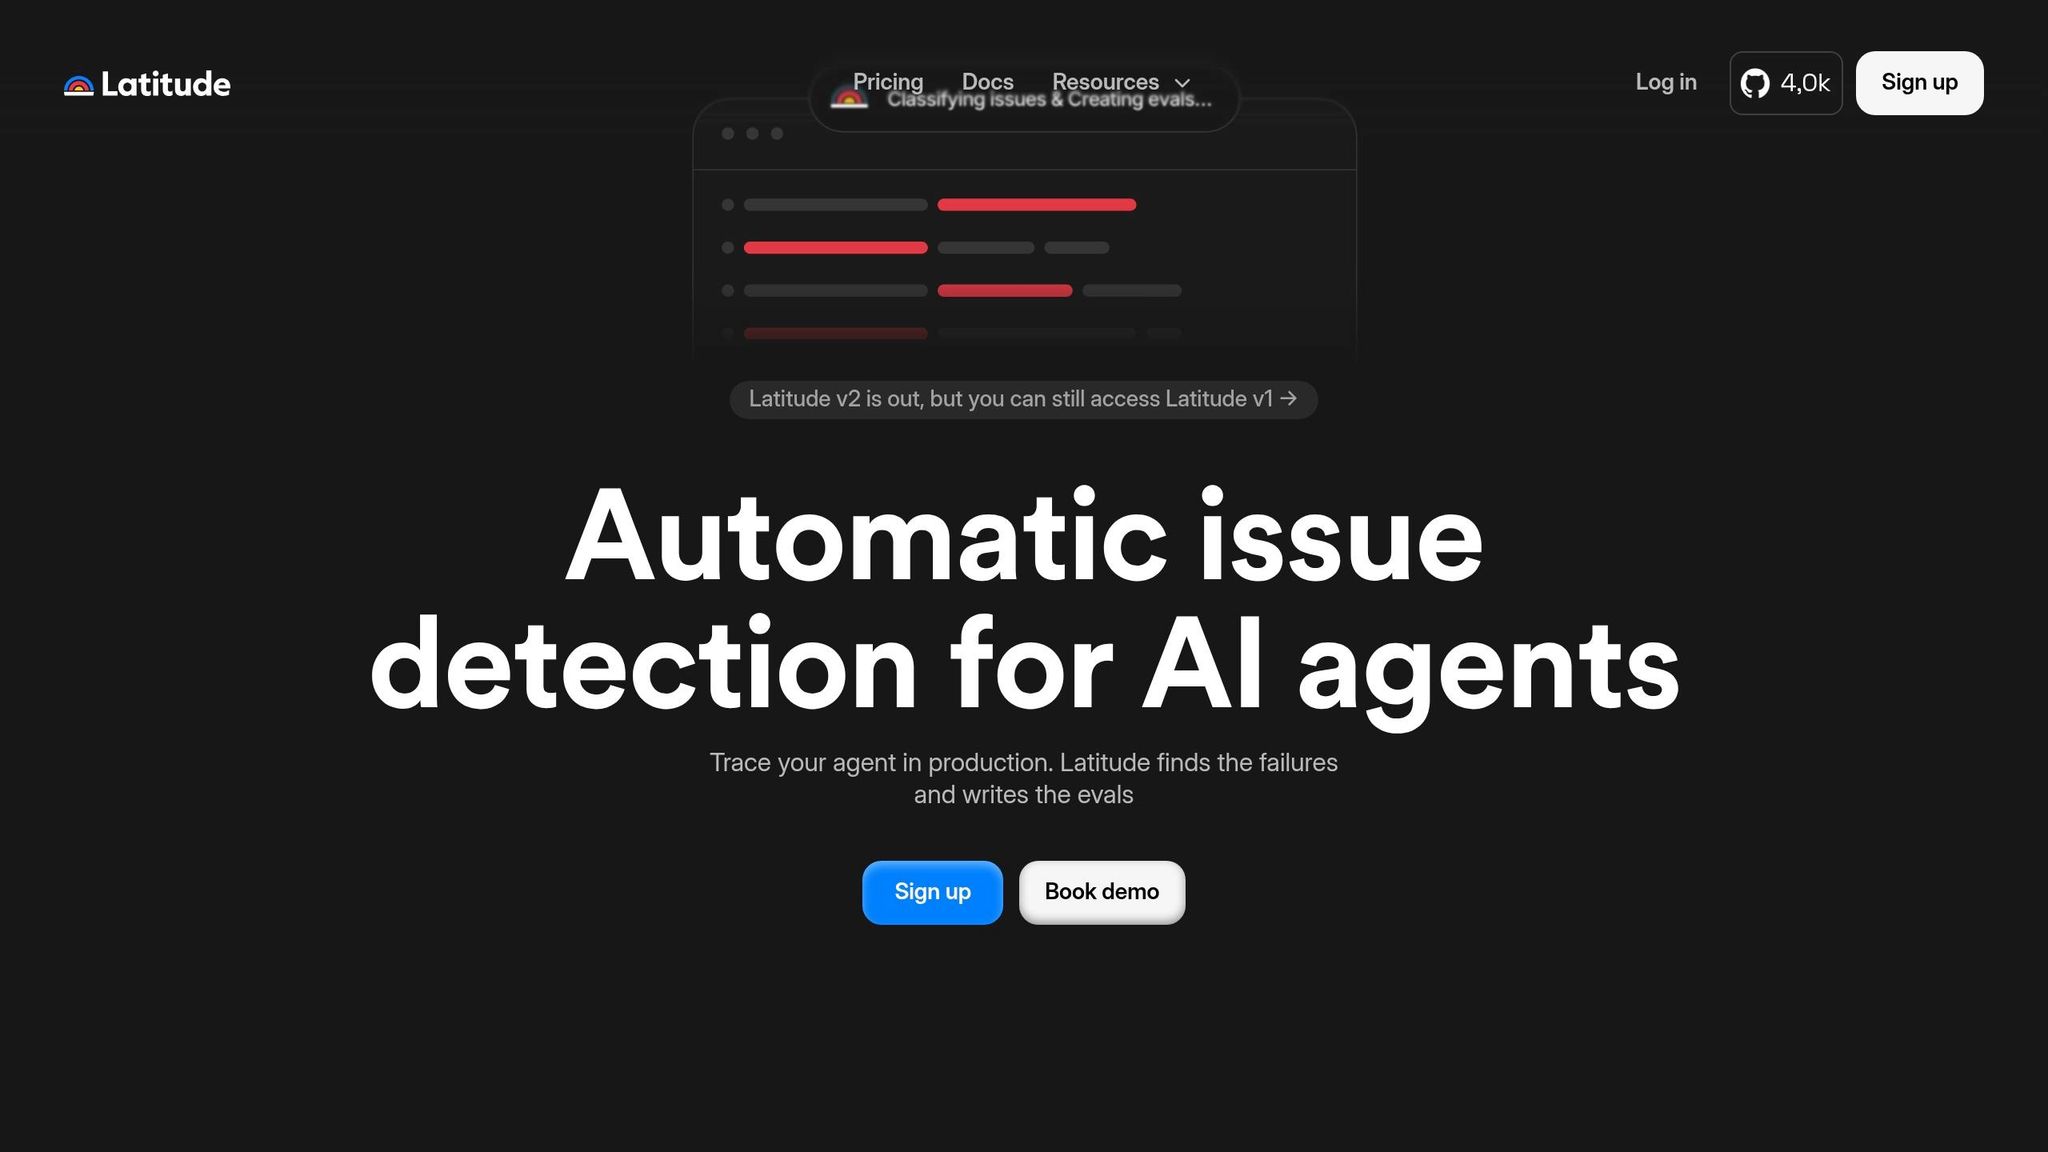
Latitude takes a smart approach to scalability by combining production monitoring with continuous testing. Their system creates a feedback loop that moves through Observability → Annotations → Error Analysis → Automatic Evals → Prompt Optimization. Essentially, every failure in production becomes a learning opportunity for future prevention.
Scalability Features
Latitude uses automated clustering to group similar failures, eliminating the need for manual regex or configuration. This is critical when you’re dealing with massive volumes - imagine trying to manually review hundreds of thousands of traces. Latitude simplifies this process and can identify 99% of failures before they affect users, needing only 10 traces to begin spotting repeating error patterns.
“Every discovered issue becomes a running eval. New traffic is tested against known failure modes automatically.” - Latitude
This automated clustering integrates directly into Latitude’s observability tools, ensuring a smooth and efficient process.
Observability Capabilities
Latitude doesn’t just capture static data - it tracks multi-turn interactions using session objects. This exposes tool calls, context flow, and pinpoint error locations. Their GEPA algorithm generates evaluations straight from real-world production failures rather than synthetic benchmarks. The result? 8x fasterprompt iteration and a 25% accuracy boost within the first two weeks.
Cost and Pricing Models
Latitude offers flexible pricing to suit different needs:
-
Free Plan : Includes 5,000 traces, 50M eval tokens per month, and a 7-day retention period - perfect for starting out.
-
Team Plan : Priced at $299/month, it covers 200,000 traces, 500M eval tokens, a 90-day retention window, unlimited evaluations, and priority support. Overage charges apply for usage beyond the plan.
-
Enterprise Plan : Custom pricing with advanced options like on-premises deployment, SOC2 & ISO 27001 compliance, SAML SSO, and fine-grained RBAC.
Integration and Automation Support
Latitude is fully compatible with OpenTelemetry(OTEL) , making it easy to integrate into your existing setup without needing to rebuild. This ensures telemetry is captured from day one, kickstarting the reliability loop immediately. Once issues are detected, they’re automatically turned into evaluations that test new traffic against previously identified failure modes.
2. LangSmith
LangSmith takes observability to the next level by focusing on database-level performance enhancements. Its custom-built SmithDB delivers impressive results: trace queries drop from 860ms to just 71ms (12x faster), full-text searches improve from 6.20s to 400ms (15x faster), and thread queries shrink from 1.16s to 131ms (9x faster). These latency reductions are a game-changer for debugging in high-volume environments, ensuring real-time evaluations are both efficient and reliable.
“SmithDB is purpose-built for agent observability… Queries, filters, and ingestion stay fast as your trace volume grows.” - LangChain
Scalability Features
LangSmith supports KEDA(Kubernetes Event-driven Autoscaling) as of version 0.13.0, which automatically adjusts queue scaling during traffic surges. In its “High/High” configuration, LangSmith can handle 1,000 traces per second on writes and 100 read requests per second with a 3-node replicated ClickHouse cluster. To ensure smooth performance, the SDK employs an async callback handler, meaning observability logging won’t slow down your live applications.
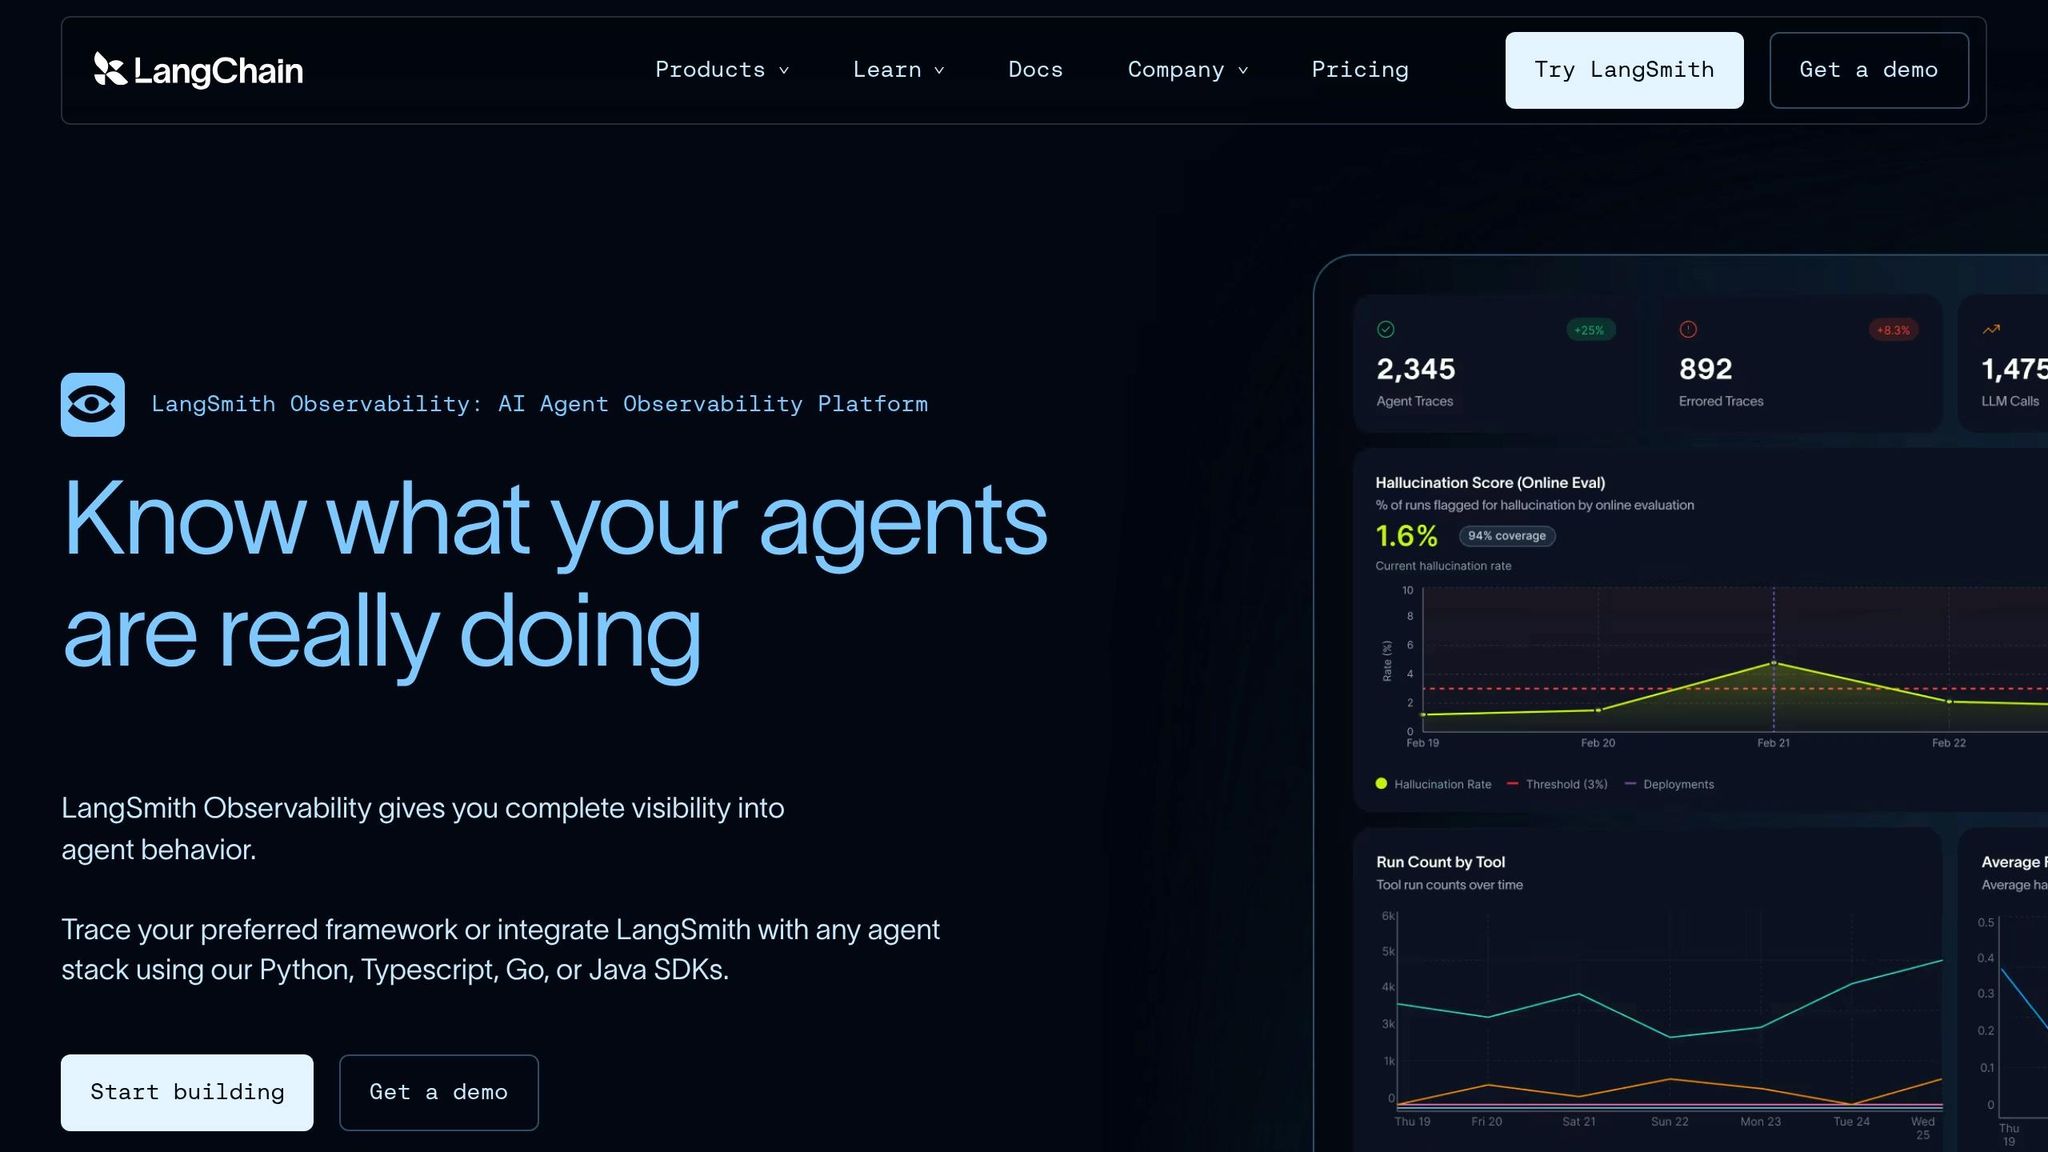
Observability Capabilities
The Insights Agent is designed to analyze millions of production traces, automatically identifying usage patterns and failure points without the need for manual tagging. LangSmith also treats multi-turn conversations as “threads”, allowing teams to evaluate entire agent interactions instead of isolated steps. For real-time quality control, online evaluations use either an LLM-as-judge or code-based scoring system to flag issues like quality drift as they occur.
Cost and Pricing Models
LangSmith combines seat-based pricing with usage-based charges:
| Plan | Price | Traces Included | Retention |
|---|---|---|---|
| Developer | $0/seat | 5,000/month | 14 days |
| Plus | $39/seat/month | 10,000/month | 400 days |
| Enterprise | Custom | Custom | Custom |
For additional traces, base traces cost $2.50 per 1,000 , while extended traces (400-day retention) are $5.00 per 1,000. For example, processing 10 million traces per month on the Plus plan would cost between $200–$400 , roughly double the cost of using Helicone.
“LangSmith is the most expensive of the three at every tier. The premium is justified if you’re deep in LangGraph; it is hard to justify otherwise.” - Particula Tech
Integration and Automation Support
LangSmith works seamlessly with tools like OpenAI, Anthropic, LlamaIndex, and Vercel AI SDK, as well as SDKs for Python, TypeScript, Go, and Java. It integrates directly into CI/CD workflows via pytest, Vitest, andGitHub Actions, helping teams catch regressions before deployment. For enterprise users, LangSmith offers self-hosting options within private VPCs on AWS, GCP, or Azure, with flexible data residency options in both the US and EU. These integration capabilities make LangSmith a comprehensive choice for high-volume, production-grade LLM evaluation.
3. Langfuse
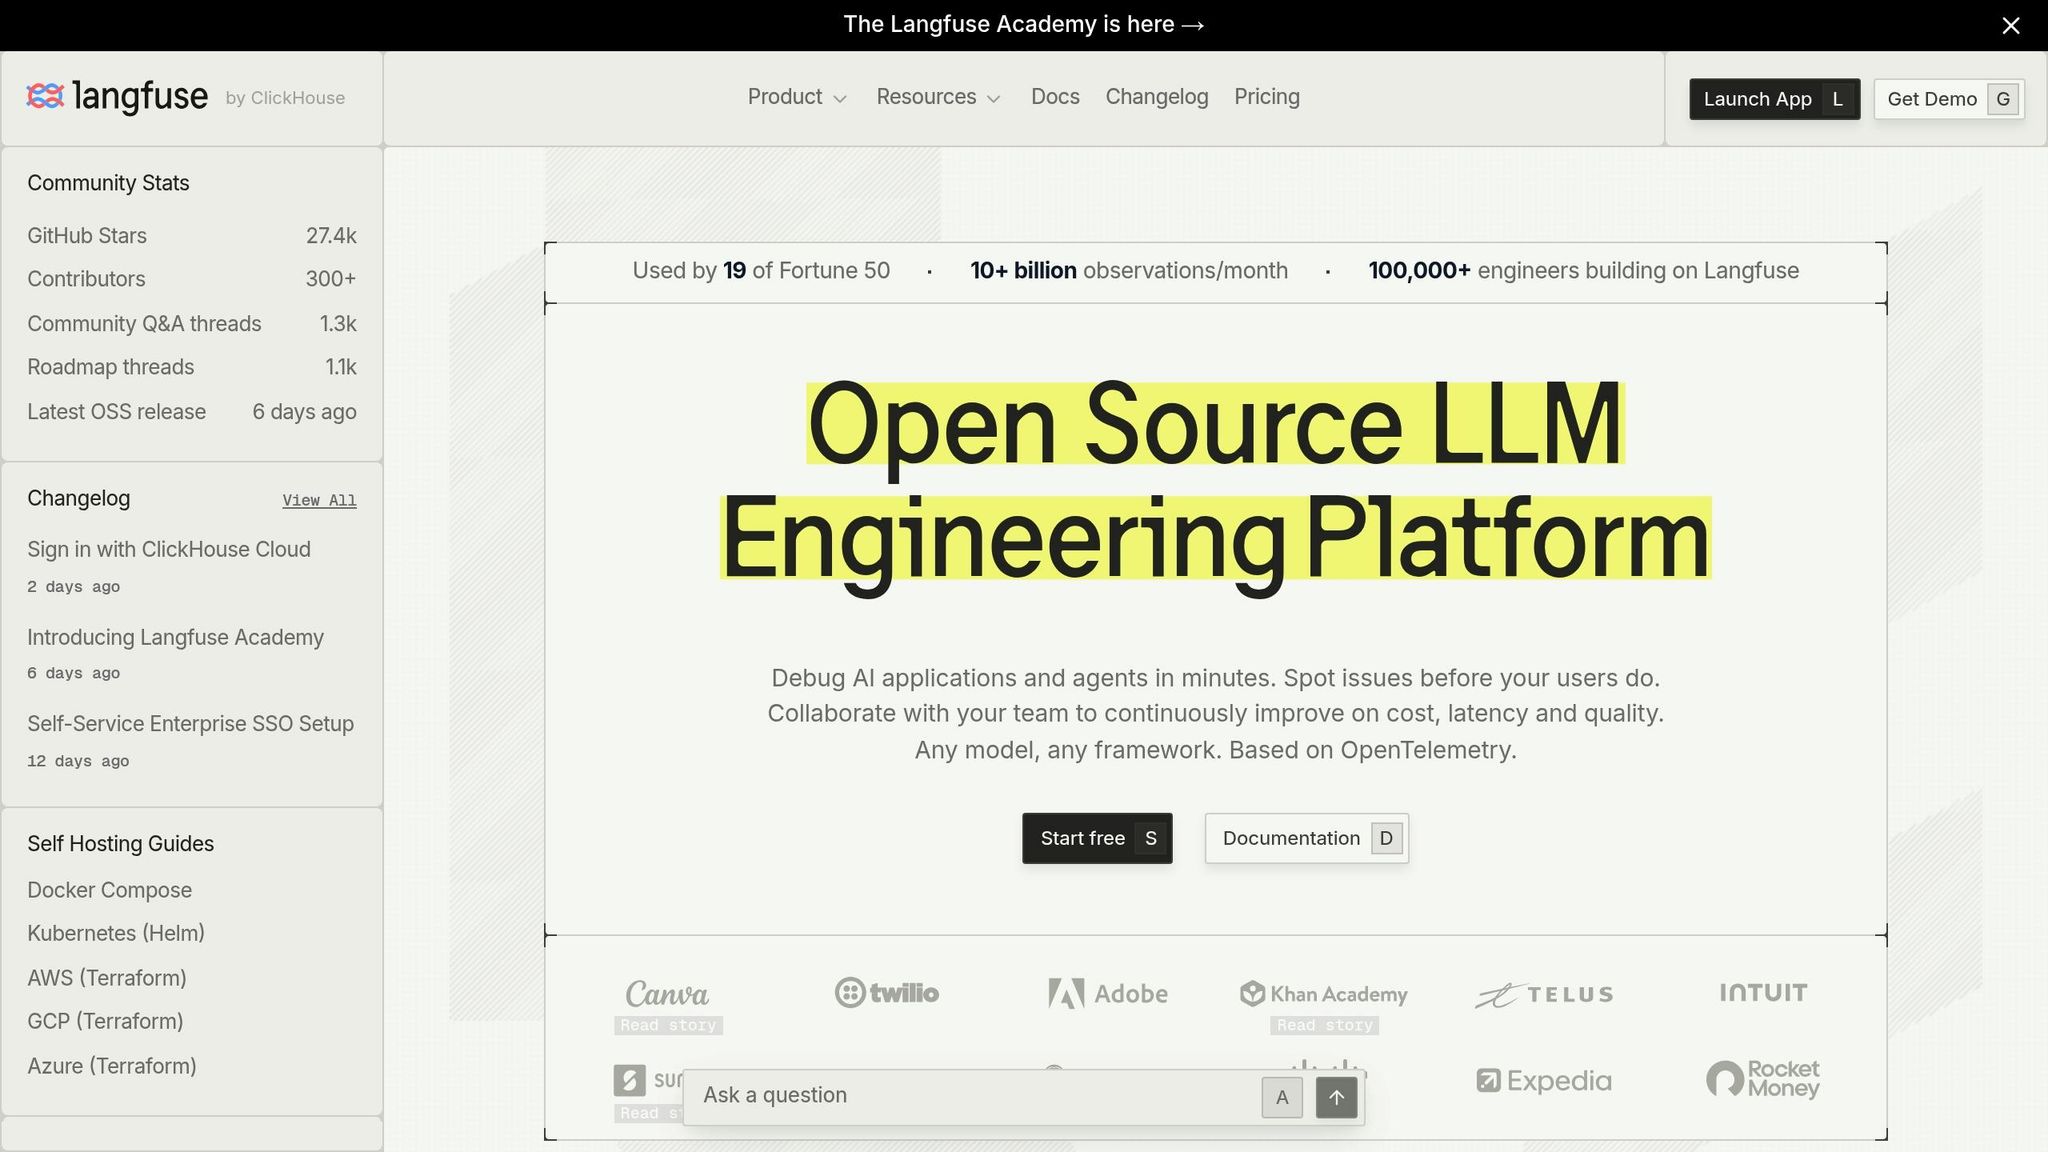
Langfuse employs a multi-component stack that includes ClickHouse for analytics, Redis for queuing, and S3/Blob storage for raw events, rather than relying on a single-database optimization. While scalability is a focus, what sets Langfuse apart is its layered approach to data processing. This design enables it to handle over 10 billion observations monthly, earning the trust of 19 Fortune 50 companies.
Scalability Features
One of the standout features of Langfuse’s V3 architecture is its asynchronous ingestion pipeline. Incoming events are routed through a Redis queue, which offloads tasks like tokenization and database writes to separate workers. This approach ensures that traffic spikes don’t slow down the application, with 90% of trace updates being written to the database within 10 seconds.
To further enhance performance, edge-cached prompts are delivered instantly while background revalidation occurs. This improvement has reduced p99 prompt API latency from 7 seconds to just 100ms. For enterprise users, Langfuse allows latency-sensitive traffic to be isolated in dedicated deployment target groups, ensuring that ingestion spikes don’t interfere with prompt retrieval or authentication.
These optimizations provide a solid foundation for Langfuse’s observability capabilities.
Observability Capabilities
Langfuse’s strong ingestion performance supports its advanced observability features, which make data analysis more efficient.
The platform has transitioned to using a wide, immutable ClickHouse table. This table consolidates every call to the best language models, tool execution, and agent step into a single, queryable structure. By eliminating the need for costly joins found in row-oriented Postgres systems, analytical queries run up to 20x faster , dashboards load 10x quicker for long-duration queries, and memory usage has dropped by 3x.
“The trace waterfall view isn’t going away… But discovery starts with the flat table: filter by observation name, type, model, cost, latency, user, session, or error status to surface the operations that matter.” - Langfuse Engineering
Langfuse is also OpenTelemetry-native, enabling cross-service trace propagation for languages like Go, Python, and gRPC. This feature is particularly useful for teams managing complex, multi-service pipelines at scale.
Cost and Pricing Models
Langfuse offers a unit-based pricing model that aligns with its scalable architecture. Costs decrease as usage increases, with a “unit” defined as the sum of traces, observations, and scores. Pricing starts at $8.00 per 100k units for lower tiers and drops to $6.00 per 100k units for usage above 50 million units.
| Plan | Base Price | Included Units | Additional Units | Data Retention |
|---|---|---|---|---|
| Hobby | Free | 50k/mo | N/A | 30 days |
| Core | $29/mo | 100k/mo | $8/100k (graduated) | 90 days |
| Pro | $199/mo | 100k/mo | $8/100k (graduated) | 3 years |
| Enterprise | $2,499/mo | 100k/mo | $8/100k (graduated) | 3 years |
Ingestion throughput limits vary by plan, ranging from 1,000 requests per minute on the Hobby plan to 20,000 requests per minute on the Pro plan. Teams anticipating high-traffic bursts should consider these limits when choosing a plan.
Integration and Automation Support
Langfuse is MIT-licensed and fully open source , making it a strong choice for teams with specific data residency or GDPR compliance requirements. It can be self-hosted using Docker Compose, Kubernetes (via Helm), or Terraform.
For evaluation workflows, Langfuse supports external pipelines triggered by webhooks. This feature simplifies the process of version-controlling custom evaluators and scheduling evaluations around critical production events. Before scaling any LLM-as-a-Judge evaluator, it’s advisable to validate it against human-labeled development sets to ensure that True Positive Rates (TPR) and True Negative Rates (TNR) exceed 90%.
4. Helicone
Helicone operates as an integrated AI gateway, positioned directly within the request path. Its infrastructure combines Cloudflare Workers for edge computing, Kafka for log processing, and ClickHouse for analytics. This setup allows it to handle ingestion and processing independently, even at massive scales. So far, the platform has managed over 9.8 billion requests and tracks 2.4 trillion tokens per month across a user base of more than 63.6 million.
Scalability Features
Helicone’s standout scalability feature is its unified AI gateway , capable of routing traffic across more than 100 models with automatic failovers. For instance, during an outage, it can seamlessly redirect traffic from OpenAI to Vertex AI or AWS Bedrock. Unlike platforms focused solely on performance monitoring, Helicone integrates active routing and caching, cutting costs and latency in real time. Its edge caching feature significantly reduces redundant API calls, delivering 20%–30% cost savings. Impressively, this infrastructure adds just 50ms–80ms of latency overhead , ensuring the observability layer remains virtually invisible to end users.
Observability Capabilities
Helicone offers session tracing that visualizes multi-step decision chains, helping teams identify where sequences break or hit context limits. It also supports custom properties , enabling users to tag requests by variables like user tier, feature, or environment. This makes it easier to pinpoint components driving costs or errors at scale. While Helicone itself isn’t an evaluation tool, it can integrate scores from external systems like RAGAS, serving as a comprehensive aggregation layer for teams conducting evaluations across multiple systems.
“Probably the most impactful one-line change I’ve seen applied to our codebase.” - Nishant Shukla, Senior Director of AI, QA Wolf
These features contribute to Helicone’s competitive pricing and adaptable usage options.
Cost and Pricing Models
Helicone adopts a hybrid pricing model , combining a flat monthly subscription for platform access with usage-based costs for high-volume logging. A key differentiator is its 0% markup on LLM provider costs when routing through its gateway. This contrasts with competitors like OpenRouter, which adds a 5.5% markup. Current pricing plans include:
| Plan | Price | Key Features |
|---|---|---|
| Hobby | Free | 10,000 requests/month, 1 GB storage, 1 seat |
| Pro | $79/mo | Unlimited seats, alerts & reports, 1-month retention |
| Team | $799/mo | SOC 2 & HIPAA compliance, 3-month retention, Private Slack |
| Enterprise | Custom | SAML SSO, on-prem deployment, permanent data retention |
Integration and Automation Support
Getting started with Helicone is straightforward: simply switch the API base URL to begin logging. For teams unable to use a proxy, an async SDK is available. Helicone is Apache 2.0 licensed , allowing for self-hosting with production-ready Helm charts for Kubernetes. This is particularly useful for enterprises with strict data residency rules. In 2025, its self-hosting architecture was streamlined from 12 containers to just 4, simplifying maintenance for large-scale deployments. The platform’s growth trajectory continued with its acquisition by Mintlify in March 2026, signaling ongoing investment and long-term support.
5. Braintrust
Braintrust takes a forward-thinking approach to the growing demand for real-time, integrated evaluation in large language model (LLM) pipelines. By embedding evaluation directly into development workflows - whether in CI/CD pipelines or live production monitoring - it ensures that assessment becomes a natural part of the development process.
Scalability Features
One of Braintrust’s standout features is its asynchronous online scoring , which evaluates production traces instantly without causing any delays. Teams can adjust sampling rates to balance visibility into production behavior with cost control. To further streamline operations, the Loop AI agent automates tasks like dataset generation, prompt optimization, and custom scorer development. This significantly reduces the manual effort typically required for large-scale evaluation.
The impact of these features is evident. For example, Notion’s AI team transitioned from manually scoring JSONL files to automated evaluations, increasing their issue resolution rate from 3 to 30 per day - a 10x improvement.
“The more rigorously they evaluated, the faster they shipped.” - Braintrust Team
These advancements lay the foundation for better production observability.
Observability Capabilities
Braintrust leverages Brainstore , a specialized OLAP database designed for AI workloads, to store trace data. This enables sub-second query speeds across millions of nested agent traces. Its token-scaled and cost-scaled timelines visually highlight expensive steps - like a 12,000-token retrieval - making bottlenecks easy to identify. Additionally, span-level cost attribution provides precise insights into which processes are driving unnecessary expenses, whether due to excessive context or runaway tool calls. By optimizing prompts through these workflows, teams can cut input token costs by 20%–40% , all without needing to modify the model itself.
Cost and Pricing Models
Braintrust operates on a usage-based pricing model , with costs driven by processed data (storage and tracing) and scores (outputs from LLM-as-a-judge or custom scorers). For those just starting out, the Starter plan is free and includes 1 GB of processed data and 10,000 scores per month.
| Plan | Platform Fee | Included Data | Included Scores | Data Retention |
|---|---|---|---|---|
| Starter | $0/month | 1 GB/month | 10,000/month | 14 days |
| Pro | $249/month | 5 GB/month | 50,000/month | 30 days |
| Enterprise | Custom | Custom | Custom | Custom |
The Enterprise plan offers additional features such as SAML SSO, RBAC, and deployment options (on-premises or hosted), which are particularly useful for teams with strict data residency requirements.
Braintrust’s pricing structure, combined with its seamless integration capabilities, ensures continuous evaluation without unnecessary overhead.
Integration and Automation Support
Braintrust integrates directly with GitHub Actions , enabling evaluations with every pull request to catch regressions before they hit production. Its SDK fits smoothly into existing workflows, while a unified AI gateway allows teams to call providers like OpenAI and Anthropic through a single interface. This simplifies model switching and keeps evaluation costs manageable by prioritizing code-based scorers (e.g., format checks, schema validation, length constraints) over LLM-as-a-judge scorers.
Braintrust’s ability to integrate, automate, and optimize makes it a powerful tool for teams aiming to streamline their LLM evaluation processes. It is one of several viral LLM tools that have gained significant traction in the developer community.
Pros and Cons
Here’s a breakdown of the key strengths and weaknesses of these platforms, highlighting how they stack up against each other:
| Platform | Key Strengths | Key Weaknesses |
|---|---|---|
| Latitude | Automatically generates evaluations from real production issues; tracks failure modes like bugs; unlimited seats on all plans | Limited to SaaS with strict caps on traces and scans in the Free plan |
| LangSmith | Zero-configuration tracing for LangChain/LangGraph; efficient trace-to-dataset feedback loop | Per-trace pricing can get costly at scale; UI performance drops beyond 100,000 traces; limited utility outside LangChain |
| Langfuse | ClickHouse-backed storage supports billions of traces with millisecond query speeds; free self-hosting; strong GDPR/HIPAA compliance | Requires manual span instrumentation; UI is less refined compared to LangSmith |
| Helicone | Quick setup thanks to proxy-based integration; semantic caching reduces API costs by 20–30% | Adds 10–50ms latency per request; lacks depth for tracing complex multi-turn agents |
| Braintrust | Asynchronous scoring minimizes latency impact; Brainstore enables sub-second queries across millions of nested traces; strong CI/CD evaluation gate | Primarily focused on evaluations, not real-time production alerting; only available as a SaaS solution |
These platforms differ significantly in how they handle cost, performance, and integration into broader LLM evaluation strategies. Scalability metrics such as throughput, latency, reliability, and cost per request reveal distinct trade-offs that teams must weigh based on their specific goals.
For instance, Helicone ’s proxy-based model can cut LLM-related costs through caching, while LangSmith ’s per-trace pricing can escalate at higher volumes. On the other hand, Langfuse offers free self-hosting, making it an appealing option for teams with strict data residency or compliance needs. For regulated industries, Langfuse stands out due to its strong alignment with GDPR and HIPAA standards.
“Langfuse is the only credible self-host option of the three… We’ve shipped Langfuse self-host inside SOC 2, HIPAA, and EU AI Act environments without architectural friction.” - Particula Tech
Braintrust is an excellent choice if your focus is on preventing quality regression. Its design is tailored to halt deployments when evaluation scores fall below acceptable thresholds. The platform’s substantial $80M Series B funding in February 2026 underscores its commitment to enterprise-grade evaluation pipelines.
Meanwhile, Latitude serves a niche by linking observability and evaluation. It excels at automatically identifying failure modes from production traffic and generating evaluations from real-world issues, making it ideal for teams looking for a seamless, integrated loop without the need to build it themselves.
Conclusion
Choosing the right tool boils down to your specific production requirements. Factors like traffic volume, budget constraints, and the level of diagnostic detail you need should guide your decision.
Here’s a quick breakdown of the tools discussed:
-
Helicone : Ideal for quick cost visibility with minimal setup - just a base URL change.
-
LangSmith : Best for LangChain or LangGraph workflows, though it can become expensive at scale.
-
Langfuse : A flexible, framework-agnostic option with a free self-hosting model for handling high volumes.
-
Braintrust : Great for ensuring quality with CI/CD gates that block regressions.
-
Latitude : Automatically generates evaluations from live failure data.
“Don’t choose a platform based solely on popularity or existing integrations - pick by what your traces look like and where governance will land in 12 months.” - Particula Tech
To help you decide, here’s a quick reference table mapping priorities to the best-fit platform:
| Your Priority | Best Fit | Why |
|---|---|---|
| Fastest setup | Helicone | Base URL swap, live in 5 minutes |
| LangChain/LangGraph debugging | LangSmith | Native state diff and node-by-node tracing |
| High volume + data residency | Langfuse (self-hosted) | Cost-effective at 100M+ traces/month |
| CI/CD quality gates | Braintrust | Blocks deployments on score regressions |
| Production-driven eval generation | Latitude | Auto-generates evals from real failure modes |
FAQs
What’s the best way to measure scalability for my LLM pipeline?
When it comes to assessing scalability in your LLM (Large Language Model) pipeline, focusing on key metrics is essential. These include:
-
Throughput : How much data your system can process in a given time.
-
Latency : The time it takes for your system to respond to a request.
-
Resource Utilization : How efficiently your system uses hardware and software resources.
-
Cost Efficiency : Balancing performance with operational expenses.
To get an accurate picture of your pipeline’s performance, combine synthetic load testing with production benchmarking. Synthetic testing helps simulate high-traffic scenarios, while benchmarking in real-world conditions provides insights into how your system performs under actual workloads.
Tools like Apache JMeter and Locust are great for generating simulated traffic to stress-test your system. Meanwhile, platforms like Latitude can automate failure detection and help track performance regressions over time.
Finally, prioritize continuous monitoring. Keeping a close eye on your pipeline ensures it stays efficient and reliable as your workloads scale up. This proactive approach helps you address potential bottlenecks before they become critical issues.
How can I keep evaluation costs low at high request volume?
To keep evaluation costs in check when dealing with high request volumes, consider using statistical sampling. Instead of reviewing every interaction, this method evaluates a representative subset of sessions, offering a balance between cost and insight. Tools like Latitude can help implement this, delivering quality insights without breaking the bank.
Another tactic is to rely on lower-cost evaluation models. Pair this with automated frameworks that turn production failures into test cases. Together, these steps help reduce expenses, maintain evaluation accuracy, and safeguard against regressions.
How do I turn real production failures into reliable evals with Latitude?
Latitude streamlines the process of transforming real-world production failures into evaluation tests. It records complete session traces, allows domain experts to annotate failures, and employs its GEPA algorithm to turn those annotations into reusable test cases. Over time, these evaluations are refined and expanded, eventually becoming part of deployment pipelines for regression testing. This approach helps ensure models are more reliable and resistant to failures.