Understand key AI latency metrics (TTFT, TPS, P95/P99) and practical fixes—streaming, model routing, caching, and observability.

César Miguelañez

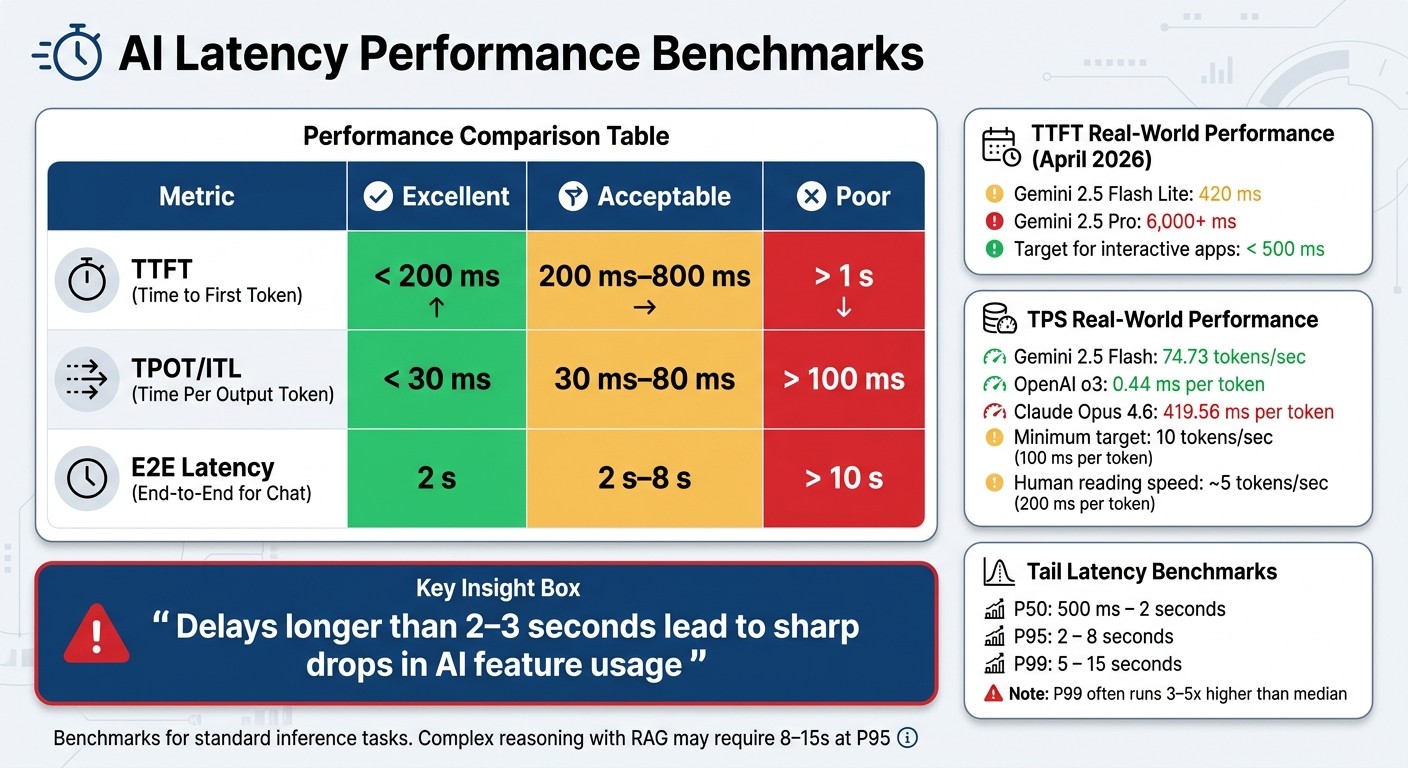
AI latency directly affects user trust and engagement. Delays longer than 2–3 seconds can lead to sharp drops in usage, while faster responses improve user satisfaction. Here's what you need to know:
Key Metrics:
Time to First Token (TTFT): Measures how fast the first word appears. Aim for under 500ms for interactive tools.
Tokens Per Second (TPS): Tracks how quickly the system generates text. At least 10 tokens per second is ideal.
End-to-End Latency: Total time for a complete response. Keep this within 2–8 seconds for short tasks.
Tail Latency (P95/P99): Highlights outliers. Monitor delays at the 95th and 99th percentiles to identify bottlenecks.
Cognitive Latency: Focuses on perceived speed, often improved with streaming responses or progress indicators.
Balancing Speed and Accuracy:
Use smaller models for quick tasks and larger models for complex queries.
Streaming responses can improve perceived speed without sacrificing accuracy.
Practical Tips:
Latency isn’t just a technical detail - it’s critical for user trust and business success. Start optimizing today to meet user expectations and improve performance.
Key Latency Metrics for AI Products
AI Latency Metrics Benchmarks: TTFT, TPOT, and End-to-End Performance Standards
When it comes to AI products, the importance of latency metrics depends heavily on the use case. For instance, interactive tools like chatbots demand quick initial responses, while batch processing systems focus more on overall throughput. Below are five critical metrics every product manager should know.
Time to First Token (TTFT)
TTFT measures how long it takes for the system to display the first word after a user's request. This is a key factor in how responsive a system feels. As of April 2026, performance varies widely: Gemini 2.5 Flash Lite starts showing the first token in 420 ms, whereas Gemini 2.5 Pro can take over 6,000 ms.
For applications like chat or code completion, keeping TTFT under 500 ms is crucial. Delays beyond a second often feel unresponsive and risk losing user engagement. Streaming responses can significantly improve perceived speed, even if the total processing time remains unchanged. Engineer-Founder Tian Pan explains:
"A response that starts appearing in 400 ms and streams for 3 seconds feels dramatically faster than one that delivers the complete text 3.4 seconds later."
TTFT is influenced by the "prefill" phase, where the model processes the input prompt. Optimizing prompt structure - placing static instructions before dynamic content - can cut TTFT by 60–80%. Once the first token is out, the system's speed shifts to Tokens Per Second (TPS).
Tokens Per Second (TPS)
TPS measures how quickly tokens are generated after the first one appears. It comes in two forms: System TPS, which reflects overall infrastructure efficiency, and User TPS, which is the speed an individual user experiences.
For a smooth experience, aim for at least 10 tokens per second, or about 100 ms per token. Since people read at around 5 tokens per second (200 ms per token), faster generation feels almost instant. As of April 2026, Gemini 2.5 Flash leads with 74.73 tokens per second, while OpenAI's o3 model produces tokens with a near-instantaneous 0.44 ms delay. In contrast, Claude Opus 4.6 lags with a 419.56 ms gap between tokens.
TPS performance is mainly limited by memory bandwidth during the "decode" phase. Reducing output length by half can slash latency by about 50%, but shortening input length only yields minor improvements of 1–5%.
End-to-End Latency
End-to-end latency measures the total time from a user's request to the final token. It combines TTFT with the time needed to generate all tokens (calculated as token generation time multiplied by total token count). This metric is particularly relevant for non-streaming tasks like document summarization, where users need the entire response before proceeding.
For short interactions, an end-to-end latency of 2–8 seconds is a practical goal. In batch tasks or background processing, the overall latency takes priority over initial responsiveness, especially when optimizing for cost and throughput.
Tail Latency (P95/P99)
Average latency can be deceptive because it doesn't account for outliers. For instance, a system with an average TTFT of 300 ms might still have a P99 latency of 4 seconds, which can frustrate users and lead to churn. P99 latency often runs 3–5 times higher than the median, with slower requests typically coming from power users running complex queries.
Benchmarks show P50 latencies between 500 ms and 2 seconds, P95 at 2–8 seconds, and P99 at 5–15 seconds. A growing gap between median and P99 latency may signal issues like memory bottlenecks or queue delays.
Cognitive Latency
Cognitive latency focuses on how users perceive waiting times. Users often judge speed based on when the first character appears, rather than when the full response is complete.
When streaming isn't an option, progress indicators or "show your steps" methods can help manage user expectations. By visibly signaling ongoing work, you can improve how users feel about waiting, even if the actual performance remains the same.
Metric | Excellent | Acceptable | Poor |
|---|---|---|---|
TTFT | < 200 ms | 200 ms–800 ms | > 1 s |
TPOT / ITL | < 30 ms | 30 ms–80 ms | > 100 ms |
E2E Latency (Chat) | 2 s | 2 s–8 s | > 10 s |
Balancing Latency and Accuracy in AI Systems
Understanding the Tradeoff
Every AI system grapples with a familiar challenge: speed versus precision. Faster models offer quick responses but might miss important details, while more accurate models deliver better results but take longer to process. Smaller models are snappy but may lack depth, whereas larger models excel in complex reasoning, albeit at a slower pace.
"A fast but inaccurate pipeline erodes trust as much as a slow but correct one."
Gareth Simono, Founder & CEO of Agentik {OS}
The right balance depends heavily on the use case. In high-stakes scenarios like medical diagnoses or financial decisions, accuracy takes precedence. A delayed but correct result is far better than a quick, incorrect one. On the other hand, applications like chatbots, autocomplete tools, or gaming NPCs often prioritize speed. In these low-risk settings, delays can frustrate users and reduce engagement.
Different industries face this tradeoff in unique ways, as illustrated by various use cases.
Use Cases and Business Impact
Industries adapt their approach to latency and accuracy based on their goals and audience. For example, B2B and enterprise-focused products tend to value reliability and auditability over speed, while B2C products often prioritize responsiveness to enhance user retention and growth.
"Accuracy measures correctness. Trust measures reliability. Users stick around only when they get both."
Carlos Gonzalez de Villaumbrosia, CEO at Product School
Here are three scenarios that highlight how these tradeoffs play out:
Real-time coding assistants: These tools require a balance of speed and quality. By leveraging powerful models with streaming capabilities, they aim to deliver results in 200–500 milliseconds.
Legal discovery systems: In this field, speed is less critical. Systems often run overnight batch jobs, focusing on maintaining high-quality outputs while keeping costs in check.
Autocomplete features: For instant feedback, these systems prioritize speed by using smaller models that meet minimum accuracy thresholds.
Take Finom as an example. In April 2026, this European fintech platform serving over 125,000 small and medium-sized businesses dramatically improved its AI processes. By adopting Confident AI, Finom reduced its AI agent improvement cycles from 10 days to just 3 hours. This approach enabled faster iteration while maintaining the accuracy demanded by its business clients. Such advancements show how businesses can navigate the latency–accuracy balance without compromising their core values.
Strategies for Setting and Monitoring Latency Goals
Defining Latency Targets
To set effective latency goals, you need to start by understanding your users' needs and expectations. For example, a conversational chatbot must feel quick and responsive - users tend to notice delays when the Time to First Token (TTFT) exceeds 200–300ms. On the other hand, a legal discovery system processing overnight batch jobs can handle much longer delays without impacting user satisfaction.
Break down your latency targets into specific budgets for each layer of your system. For instance:
Network: 50ms
Retrieval: 150ms
TTFT: 400ms
This layered approach helps identify where delays occur, making it easier to address bottlenecks.
"If you set your SLO based solely on median performance, you ignore users experiencing worst-case delays."
Tian Pan, Engineer-Founder
When defining goals, focus on percentiles rather than averages. Averages can mask extreme delays, which often affect your most engaged users submitting complex queries. Industry benchmarks suggest targeting a P50 latency between 500ms and 2 seconds, and a P95 latency between 2 and 8 seconds for standard inference tasks. For simpler completions, aim for a P95 of under 2 seconds. More complex tasks, such as reasoning with RAG retrieval, might require a P95 of 8–15 seconds.
Perceived latency is just as important as actual latency. Techniques like streaming allow users to start consuming content within 200–500ms, even if the full response takes longer.
Once your targets are set, ongoing monitoring ensures your system performs as expected.
Monitoring Latency in Production
Setting clear targets is only half the battle - continuous monitoring is essential to maintain performance. Break latency into three key components:
TTFT: Measures responsiveness.
Time Per Output Token (TPOT): Tracks how quickly the system streams results.
End-to-End Latency: Captures the total time for the user experience.
By monitoring these components separately, you can pinpoint whether delays occur during queuing, embedding, retrieval, or generation stages.
Advanced techniques like distributed tracing (e.g., OpenTelemetry) provide a detailed view of where delays occur. Tagging requests with metadata such as model_name, prompt_version, user_id, and network_type helps with root-cause analysis when latency spikes.
"Monitoring tells you something broke. Observability tells you why - and that distinction matters a lot more when your system's failures look exactly like successes."
Mert Batur Gürbüz
Instead of waiting for thresholds to be breached, monitor error budget burn rates. This proactive approach catches performance issues before they escalate into Service Level Objective (SLO) violations. For example, implement tiered timeouts:
Fast Timeout: Sends a duplicate request to an alternate provider.
Slow Timeout: Returns a degraded response.
This strategy can reduce P99 latency by up to 96%, albeit with a 5–10% cost increase.
Another effective approach is model routing. Assign simpler tasks to lightweight models like Claude 3.5 Haiku, which costs $1.00 per 1,000 requests, and reserve more complex queries for larger models like GPT-4o, which costs $12.50 per 1,000 requests. This not only improves latency for routine queries but also reduces costs significantly, thanks to the 12x price difference between these models.
Tools and Platforms for Latency Observability
Latitude: Latency Tracking and Debugging
When it comes to monitoring latency in production, having the right observability platform makes all the difference. Latitude (https://latitude.so) is designed to focus on real-world production issues instead of relying on synthetic benchmarks. It automatically detects and tracks failure modes in AI systems, using data from actual production traffic. This ensures you're addressing genuine latency challenges rather than guessing which scenarios to test.
Latitude starts with annotation queues that help you review anomalies and edge cases. When latency spikes occur, the platform captures the context and enables you to turn those incidents into automated evaluations. This approach helps prevent regressions before they affect users. Additionally, Latitude keeps track of evaluation quality over time, so you can see if your latency improvements are making an impact.
The pricing structure includes:
Free tier: 5,000 traces/month, 500 trace scans, and 50 million evaluation tokens.
Team plan: $299/month, offering 200,000 traces, 20,000 trace scans, 90-day data retention, and priority support.
Enterprise plans: These include on-premises deployment and dedicated support for larger teams.
Comparison of Other Tools
There are several other platforms available, each catering to different priorities like cost efficiency, detailed tracing, or automated debugging. Here’s a look at some alternatives:
Helicone: Known for its semantic caching, which can reduce LLM API costs by 20–30%. It offers a free tier for 10,000 requests/month and a Pro plan at $79/month, making it a good option for teams focused on cost control.
Langfuse: Ideal for teams with strict data privacy needs, Langfuse provides a self-hosted version for free. The Cloud Pro plan is available for $199/month.
LangSmith and Braintrust: These platforms emphasize comprehensive tracing and debugging capabilities. While they excel in general LLM observability, they’re less focused on latency-specific workflows. LangSmith, for example, integrates seamlessly with the LangChain ecosystem, making it a better fit for teams looking for broader observability across their LLM stack.
If your main goal is to catch and address latency regressions before they reach production, Latitude’s ability to generate automated evaluations from real issues gives it a unique edge. However, for broader observability needs or specific concerns like cost management or privacy, other platforms like Helicone, Langfuse, or LangSmith might be more suitable.
These tools give product managers the ability to detect, analyze, and resolve latency issues while aligning with their team’s performance goals. Whether your focus is cost, control, or automation, there’s a solution tailored to your needs.
Conclusion
Latency goes beyond being a technical detail - it's a critical factor shaping user trust, engagement, and the success of your AI solutions. As the Statsig Team aptly states:
"Speed is the first thing users notice. Slow replies break focus and trust within seconds".
Studies confirm this: delays longer than 2–3 seconds often lead to sharp declines in AI feature usage.
To address this, perceived latency should take center stage. Strategies like streaming responses can make interactions feel faster, while simplifying prompt complexity and utilizing tools like semantic caching and model routing can deliver noticeable performance improvements. Prioritize metrics such as TTFT (Time to First Token), TPOT (Total Processing Overhead Time), and tail latencies, as averages can obscure the poor experiences of your most active users.
Start with actionable steps: adopt streaming if it's not already in place, streamline prompts to reduce input tokens by 30% (potentially cutting latency by 20–25%), and implement semantic caching for frequently asked questions to bypass model processing altogether. For more advanced optimization, explore model routing - assigning simpler tasks to faster models while reserving complex queries for more powerful ones can reduce median latency by 40–60%.
Once performance strategies are underway, shift your focus to observability. A strong observability platform is essential. Whether you opt for Latitude for production monitoring, Helicone for cost management, or Langfuse for privacy considerations, the key is to start tracking now. Without measurement, improvement isn't possible, and in the AI world, every second of delay impacts user satisfaction and your business outcomes.
FAQs
Which latency metric should I prioritize for my AI feature?
Measuring the response time to the first token is a key factor when evaluating your AI feature's performance. This metric plays a big role in shaping how users perceive the speed of your system. A quick response reassures users, making the interaction feel seamless and trustworthy.
By focusing on this, you can improve the overall user experience, ensuring it feels smooth and dependable right from the start.
How do I set realistic P95/P99 latency targets for my users?
When determining P95 and P99 latency targets, it’s important to consider both industry standards and how your system performs, particularly if you're working with large language models (LLMs). Generally, P95 latency falls between 2 to 8 seconds, while P99 latency ranges from 5 to 15 seconds.
Start by analyzing your system's current metrics. Identify any outliers that may skew performance and address them to improve consistency. Strive for user-friendly performance - ideally, aim for a sub-2-second P95 latency to enhance user experience.
To maintain these targets, regularly review your performance metrics and leverage observability tools. This helps ensure your system delivers reliable and predictable results over time.
What’s the fastest way to improve perceived speed without changing models?
Optimizing the orchestration pipeline is one of the fastest ways to improve perceived speed. This involves a few key adjustments: reducing request frequency, parallelizing workflows, and implementing caching. Together, these changes can slash latency by as much as 70%, all without altering the model itself.


