
If you only test an LLM before launch, you will miss production failures. This piece makes one point clear: live evals need to score output quality, safety, grounding, and tool use after traffic starts flowing, not just before release.
I’d sum it up like this:
-
Offline tests are not enough. User behavior shifts, prompts change, and model updates can slip in bad behavior without obvious alerts.
-
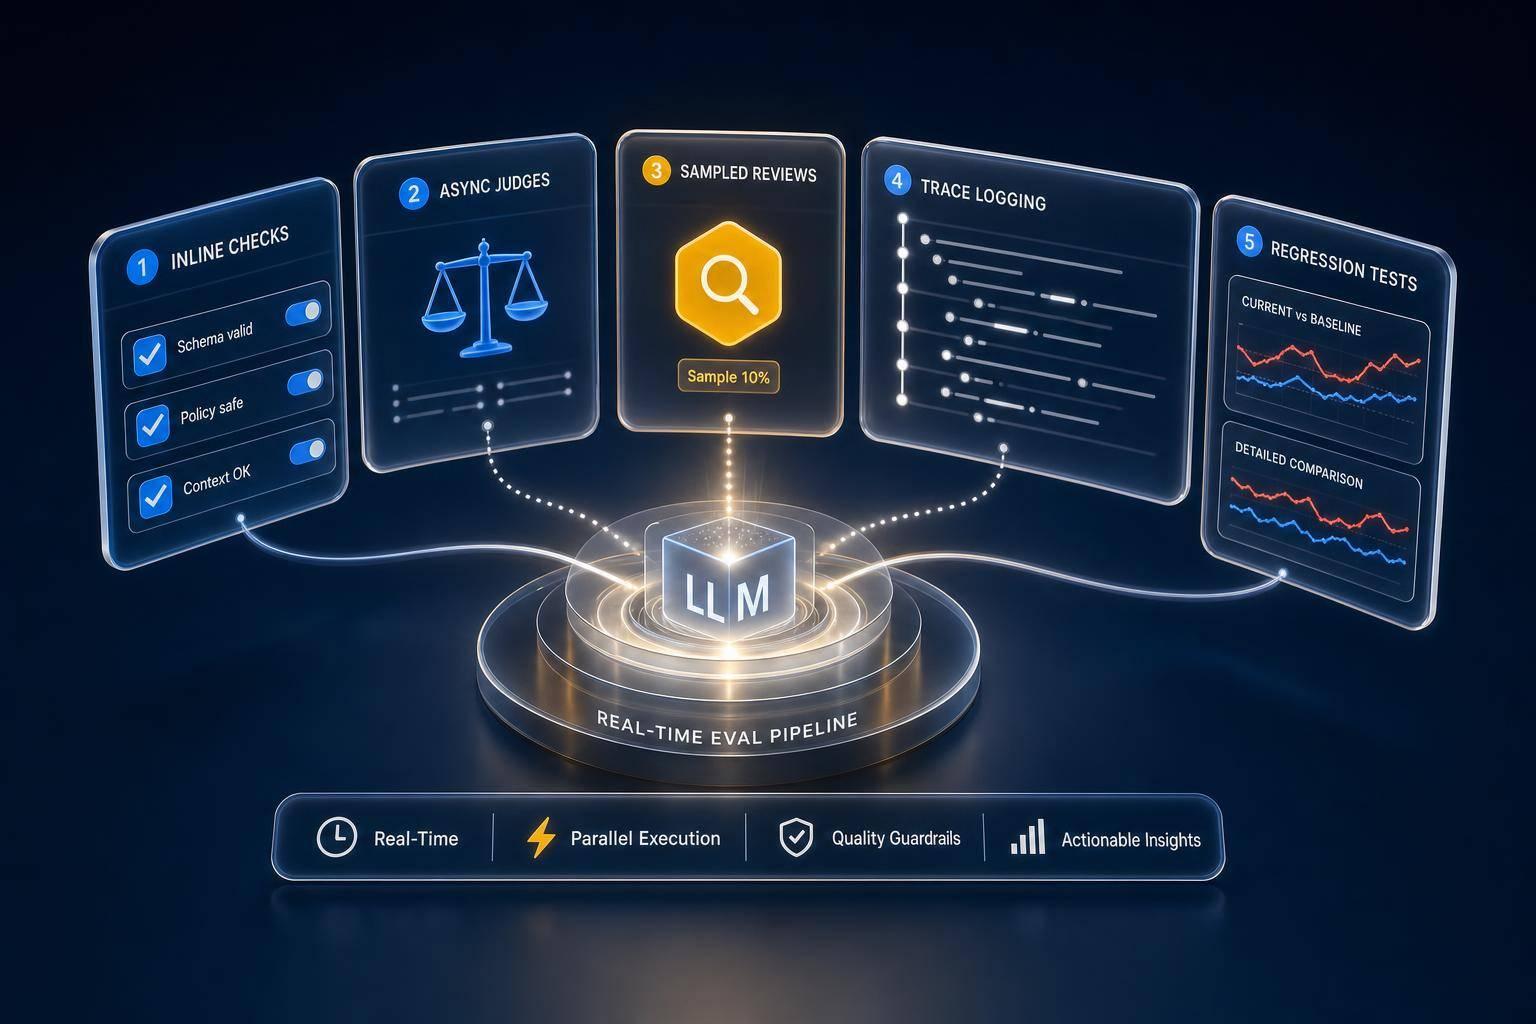
Most teams need 3 eval paths: inline checks, async scoring, and sampled review.
-
Start cheap first: rules for schema, PII, and citation checks on 100% of traffic.
-
Use LLM judges sparingly: often on 1%–10% of traces, plus 100% of high-risk cases.
-
For agents, score each tool step , not just the final answer.
-
Store rich traces so I can replay failures and find the cause fast.
-
Turn bad live traces into regression tests so the same issue does not ship again.
-
Tie evals to alerts, canaries, and on-call so quality problems are treated like production incidents.
-
Keep privacy rules tight: redact PII, limit retention, and control review access.
A few numbers stand out. The article says 78% of AI agent issues in production are silent failures. It also notes that a judge that costs $0.01 per call can reach about $30,000 per month per metric at 100,000 requests per day. That’s why sampling and filtering matter so much.
Here’s the short version of the system I’d build:
| Part | What I’d do |
|---|---|
| Trace data | Log prompts, context, tool inputs/outputs, versions, latency, cost, and user signals |
| Inline checks | Block clear failures like bad JSON, PII, or invalid tool names |
| Async evals | Score faithfulness, answer quality, and agent behavior after response delivery |
| Sampling | Review a slice of normal traffic, but always score errors and escalations |
| Feedback loop | Send flagged traces to review, label them, and add them to regression sets |
| Release control | Run shadow tests, canaries, and gating before wider rollout |
| Incident flow | Alert on drift versus a 7-day baseline and attach runbooks and deploy history |
So if I had to reduce the article to one line, it would be this: the smallest eval loop that works is to log good traces, score the risky stuff, and turn failures into tests every week.
Below is the article section.
How to Design a Real-Time Eval System
What to Capture in Every Trace
A trace only helps if it shows what broke and why it broke. That means you need more than the final answer. Capture the full conversation, retrieved context, tool inputs and outputs, model and prompt versions, per-stage latency, token usage, cost, and user feedback signals like thumbs up/down or copy clicks.
| Field | Why It Matters |
|---|---|
| User Input / Message History | Full context for replayability and root-cause analysis |
| Retrieved Context | Lets you verify whether the model’s answer was grounded |
| Tool Calls & Arguments | Validates agent reasoning at each step |
| Model & Prompt Version | Isolates regressions caused by provider updates versus your own changes |
| Latency & Token Usage | Tracks performance and feeds cost attribution |
| User Feedback Signals | Calibrates automated judges against real user reactions |
One practical move: write eval scores back to the original trace as span attributes instead of putting them in a separate table. That keeps the whole story in one place and saves you from messy joins later.
Once these fields are in place, you can decide where scoring belongs based on latency limits and risk.
Inline, Async, and Sampled Eval Pipelines Compared
| Pattern | Latency Impact | Infrastructure Complexity | Cost | Best-Fit Use Case |
|---|---|---|---|---|
| Inline (Sync) | High - blocks the response (50ms–2s+) | Moderate - requires a gateway or sidecar | Low to high | Safety, PII, prompt injection, blocking |
| Async (Background) | Zero - runs off the critical path | High - needs queues and workers | High | Quality scoring, faithfulness, hallucination detection, agent reasoning |
| Sampled | Zero | Low to moderate | Low | Baseline drift monitoring, high-volume routine traffic |
If you run an LLM judge on every request, the bill adds up fast. At about $0.01 per call, 100,000 requests per day turns into $30,000 per month per metric. That’s the whole reason async and sampled pipelines matter so much. Without them, evals can get expensive in a hurry.
For safety-heavy paths, inline checks are not optional. But even there, the judge should fail open if the model itself goes down. In plain English: don’t block the user just because the evaluator had a bad day. Score it later in batch instead.
Before any judge runs, start with the cheap filters. That’s usually the easiest way to cut waste.
How to Keep Eval Costs Under Control
Once your traces are structured, cost control mostly comes down to filtering and sampling. Deterministic checks like regex for PII, JSON schema validation, and citation integrity checks can catch a big chunk of obvious failures for almost no cost. Then you send only the traces that clear those checks to an LLM judge.
A common setup looks like this:
-
Run heuristic checks on 100% of traffic
-
Limit LLM-as-judge scoring to 1–10% of traces
-
Always capture 100% of error traces like timeouts, tool failures, and low-confidence outputs, because that’s where the most useful failures tend to show up
Caching helps too. If you key evaluator caching by output hash, identical outputs don’t get scored twice. And if you use idempotent score keys based on (trace_id, rubric_version, judge_model), you avoid duplicate charges when a worker crashes halfway through a run. In busy systems, that can cut a lot of repeat judge calls without losing coverage on the traces you care about most.
“The hard part of online evals is the control loop, not the tooling.” - Mariyam Ayoob, Towards AI
Platforms such as Latitude can surface failure modes and turn them into evals from real production issues so teams can debug faster and prevent regressions before users are impacted.
Which Metrics and Signals to Track in Real Time
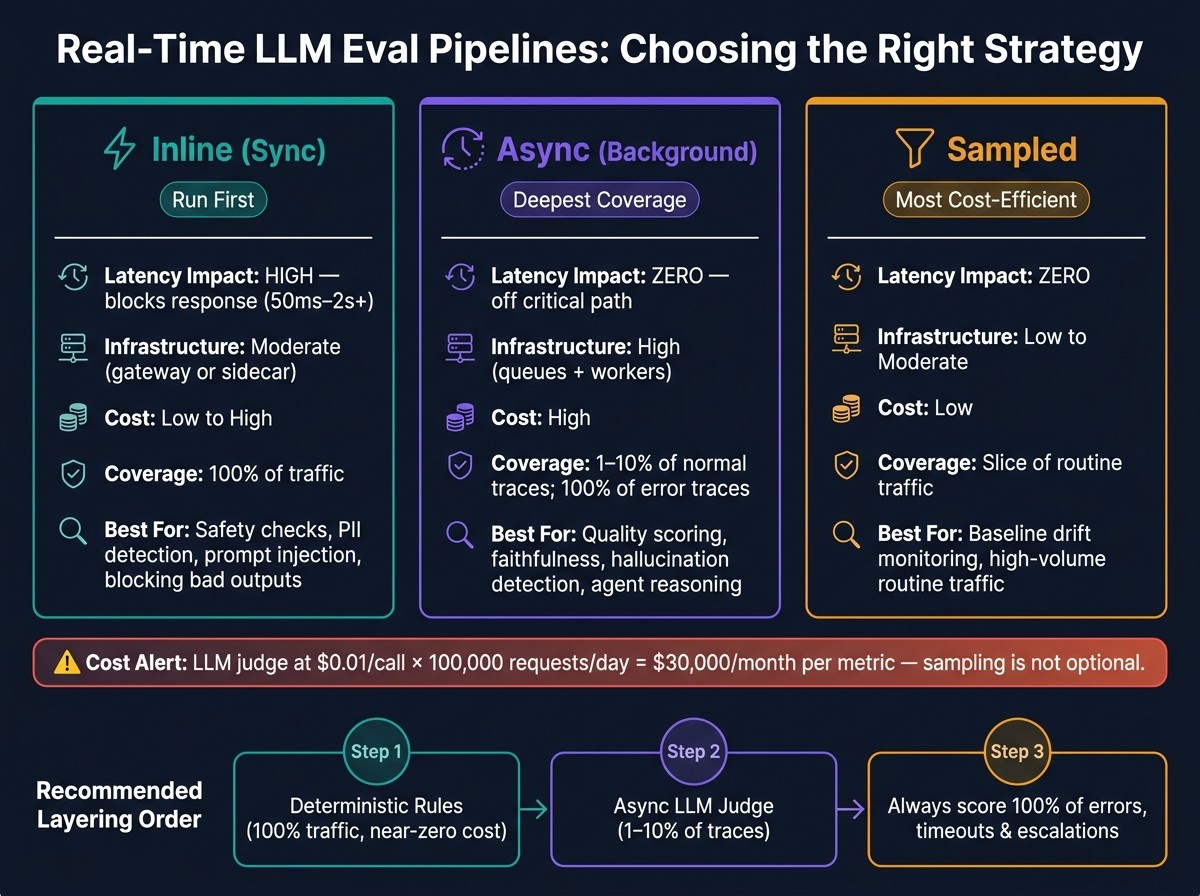
Real-Time LLM Eval Pipelines: Inline vs Async vs Sampled
Automated Scores for Quality, Safety, and Tool Reliability
Once full traces are in place, the next move is simple: score the signals that hint at production failure before users feel the damage. A practical setup uses four layers: deterministic checks, RAG metrics that don’t need a gold answer, LLM-as-judge, and human calibration.
Start with deterministic checks because they catch a big chunk of the obvious stuff fast. JSON schema validation, regex for PII, exact-match checks for IDs, and tool-call name verification can stop bad outputs before any model-based judge even runs. For RAG, track faithfulness, answer relevance, and context precision. For agents, watch tool-selection accuracy and step efficiency. You should also track TTFT, TPOT, total latency, and cost per successful task. If the output is too slow to be useful, that still counts as failure.
Use LLM judges for semantic quality, and use rules for yes-or-no checks. That split matters. GPT-4 as a judge matches human agreement at over 80% on benchmarks like MT-Bench, which is strong, but it still misses edge cases where a hard rule would flag the problem in a second.
| Method | Speed | Cost | Precision | Best For |
|---|---|---|---|---|
| Rules | Instant | Near-zero | High | Schema, PII, exact match |
| Classifiers | Fast | Low | Moderate | Toxicity, safety, sentiment |
| LLM Judge | Seconds | Moderate | Moderate–High | Faithfulness, tone, relevance |
| Human Review | Days | High | Very High | Calibration, high-stakes edge cases |
User Feedback and Behavioral Signals Worth Tracking
Explicit ratings like thumbs up or thumbs down help, but they only show part of the picture. Some of the best signals come from what users do, not what they say.
Repeated prompts often mean the first answer missed the mark. Session abandonment right after a response can point to confusion or failure. Escalations to a human agent are one of the clearest warning signs you can get because the user has, in effect, said the AI wasn’t good enough. Edit distance between the model’s answer and the user’s correction shows how far off the response was.
A good routing policy ties each signal to an action:
-
Thumbs-down votes and explicit user frustration should trigger immediate human review and export to the golden set.
-
Repeated prompts and rephrasing should route to an LLM judge for semantic analysis.
-
Session abandonment can move into an async review queue.
-
Thumbs-up signals and task completion should feed baseline quality aggregates.
The key idea is to treat these signals as inputs, not final judgments. Calibration is what turns messy behavior into metrics you can trust.
How to Turn Weak Signals into Reliable Metrics
Behavioral signals are noisy by nature. One abandoned session might just mean the user got pulled into a meeting. But if abandonment keeps showing up after one intent type, that’s not random noise anymore. That’s a product issue waving a red flag.
To make these signals useful, validate every scorer against human labels before you use it as a gate. Aim for 85% agreement with human reviewers on a 50–100 example calibration set. Skip that step, and you’re not measuring quality. You’re measuring the judge’s own bias.
You also need to watch for evaluator drift. Products change. Users change. What looked like a good answer six months ago may not match what “good” means now. Refresh 10%–20% of the golden set each quarter. And when you pick a judge model, don’t let a model grade itself. Using GPT-4o to judge GPT-4o creates self-judging bias and can inflate scores without matching actual output quality.
Flagged traces should flow into annotation queues, and the golden set should be refreshed as product behavior shifts. Those same signals should then feed regression tests and release gates.
From Live Failures to Regression Tests and Release Gates
How to Turn Bad Traces into Eval Datasets
When live scoring flags a failure, turn that trace into a regression case right away before it gets buried in logs. A flagged trace by itself doesn’t do much. It only becomes useful when you label it and put it back to work.
Send each flagged trace to annotation, label the failure, and attach the original inputs, steps, and tool results. A reviewer should confirm the issue, add a label like wrong tool call , hallucination , or context loss , and mark it for promotion. Include the full trace context - inputs, intermediate steps, and tool results - so someone else can reproduce the failure later.
Before you promote anything, group traces by failure pattern. If several traces show the same tool misfire, promote one example that stands in for the rest. Otherwise, your eval suite can get stuffed with near-duplicates, and that creates overfitting risk. When you write graders, aim them at the failure type, not the exact bad answer the model gave. For example, check whether the tool name is in the allowed set, rather than matching one wrong output. The next failure probably won’t look exactly the same.
“The durable fix is to treat production traces as the source of truth for regression evals.” - Braintrust
Those labeled traces then become the cases you use to stop the same regression from slipping through again.
Using Observability Platforms to Close the Feedback Loop
“In software, the code documents the app; in AI, the traces do.” - Harrison Chase, CEO, LangChain
Use a platform that can turn production traces into datasets, keep reviewers in one loop, and tie failures to regression tests. LangSmith, Braintrust, Langfuse, Helicone, and Latitude all shorten the trace-to-dataset loop in different ways. The main difference is how directly each one links a flagged trace to a labeled dataset row and then to a regression test. Latitude treats failures more like bugs than log entries, and it auto-generates evals from real production issues.
Canary Releases, Shadow Traffic, and Blocking Regressions
Once the dataset is ready, use it in shadow runs and canary releases before any deploy gets permission to block traffic.
Start with shadow mode, then apply the same checks you plan to use as release gates. Run new evaluators on live traffic without blocking anything at first, and calibrate them against human-labeled examples before turning them into blocking checks in CI.
For canary releases, send a small share of production traffic through the new prompt or model version and score those traces in real time with the same eval suite used in CI. Require 100% pass rates for deterministic checks and calibrated thresholds for semantic scores. If a regression shows up, push it into the same engineering workflow you use for any other bug. Give each regression an owner, a severity level, and a linked trace.
Those linked regressions should then feed alerting and incident response in production.
Running Real-Time Evals as a Production Reliability System
Alert Thresholds, On-Call Workflows, and Incident Response
Once evals become release gates, those same scores should also drive on-call response.
A simple place to start is a three-band policy: passing scores move forward, borderline results go to async review, and high-risk outputs page on-call right away. Page only when there’s a sustained deviation from the 7-day baseline. Smaller swings can go to silent review instead.
“The 7-day baseline is long enough to average over a single bad batch but short enough to track legitimate distribution shifts.” - Matthew Diakonov, PIAS
When an alert fires, include the 24-hour mean versus the 7-day baseline, the sample size, a link to the runbook, and a list of recent deploys. Use the same quality, safety, and tool-reliability scores for alerts. Deterministic guards should run on 100% of traffic , while LLM judges can be sampled - except for high-risk events like tool errors, max-turn hits, and thumbs-downs, which should always be checked.
Privacy, Retention, and Review Policies
Once traces are part of incidents and reviews, retention and access control stop being nice-to-have items. They become production rules.
These traces often contain user data, so PII should be redacted at emission. Hash user IDs, strip emails, and keep only what’s needed for review. In tightly regulated fields like healthcare and finance, sensitive content is often hashed or tokenized before logging. That way, teams can still search traces by metadata without exposing raw content.
A common retention setup looks like this:
-
30 days for troubleshooting
-
90 days for recurring root-cause analysis
-
12 months for drift review
Human review should be saved for cases that automated checks can’t settle. And when a reviewer does inspect a trace, capture the expected output and add it to the regression set. That turns a one-off fix into something you can reuse in the next offline eval dataset.
Conclusion: The Smallest Real-Time Eval Loop That Works
The goal here is simple: build a small loop that catches regressions fast and feeds them back into the eval suite.
Capture traces, score a small sample, tag high-risk events at 100% , and turn failures into regression tests.
The habit that matters most is Friday triage: spend 30 minutes each week pulling the 30 worst-scoring production traces and turning them into new regression tests. It’s a small ritual, but it adds up. Over time, you get a regression suite built from what actually breaks in production, not what someone guessed might break during development.
“The day you launch is the day your evaluation strategy must change fundamentally. In development you evaluate once against a static test set; in production the world moves under your feet.” - Building Language AI
Start with the smallest loop that gives you a signal. Measure it. Add more coverage only where production risk justifies the cost.
FAQs
What should I evaluate first in production?
Start by finding your failure modes first. Don’t pick metrics out of thin air.
A good way to do this is to review 50 to 100 real production traces and build a failure mode taxonomy from what you see. In plain English: map out the ways the system can fail before you decide how to measure it.
For the first milestone, put deterministic inline checks on every live response at the top of the list. That means checks for things like:
-
Schema validity
-
Groundedness
-
Key policy violations
Do that before you lean on human reviews or LLM-as-judge. The idea is simple: catch the clear, repeatable failures in production first, right where they happen.
How much traffic should LLM judges score?
Not every response needs an LLM judge score. A tiered setup works better: run deterministic checks across all traffic to catch obvious failures first, then route the rest based on risk.
For medium-risk traffic , always use a judge. Do the same for high-risk cases when you need semantic confirmation, not just rule-based checks. For low-risk traffic , a small sample is usually enough.
In production, teams often sample 5% to 10% of total traffic for ongoing monitoring.
How do I turn live failures into regression tests?
Capture the failed trace with the full production context: the input, model output, tool calls, and runtime metadata. That gives you the whole picture, not just the part that broke.
Then label the failure mode, save that trace in a versioned eval dataset, and write a task-specific scorer that can flag the same pattern on its own.
Add the scorer to your CI pipeline so deployments get blocked if the issue shows up again. Latitude can help here by surfacing failure modes, tracking them as bugs, and turning production issues into evals.