
Most agent failures don’t throw errors. They just drift off course. In the article, I’d boil the main point down like this: if I want to debug multi-turn agents, I need to trace the entire conversation , not just single requests. That means linking every turn with a stable session_id, tracing LLM calls, tools, memory, and guardrails, and checking success at the conversation level.
Here’s the short version:
-
Single-turn logs are not enough for multi-turn agents
-
78% of production agent failures are silent , not hard crashes
-
I need session-level tracing to follow context, retries, loops, and tool choices
-
I should track tokens, latency, and cost per conversation , not only per call
-
I need evals built from production failures , then run them before prompt, model, or workflow changes ship
-
Good setup also means tail-based sampling, redaction, retention rules, and shared IDs across traces, logs, and metrics
A few points stood out to me.
First, broken lineage is one of the biggest problems. If each turn starts a new trace, I lose the path of the conversation. Then I can see a tool call happened, but I can’t see what caused it.
Second, turn-level metrics can look fine while the session still fails. An agent may answer one message well, then lose context by turn 6, repeat itself, or get stuck in a retry loop. That’s why conversation-level scoring matters.
Third, cost is more than a finance metric. If one session spikes to 5x the median , that can signal loops, retries, or bad reasoning paths. In other words, spend can help me find bugs.
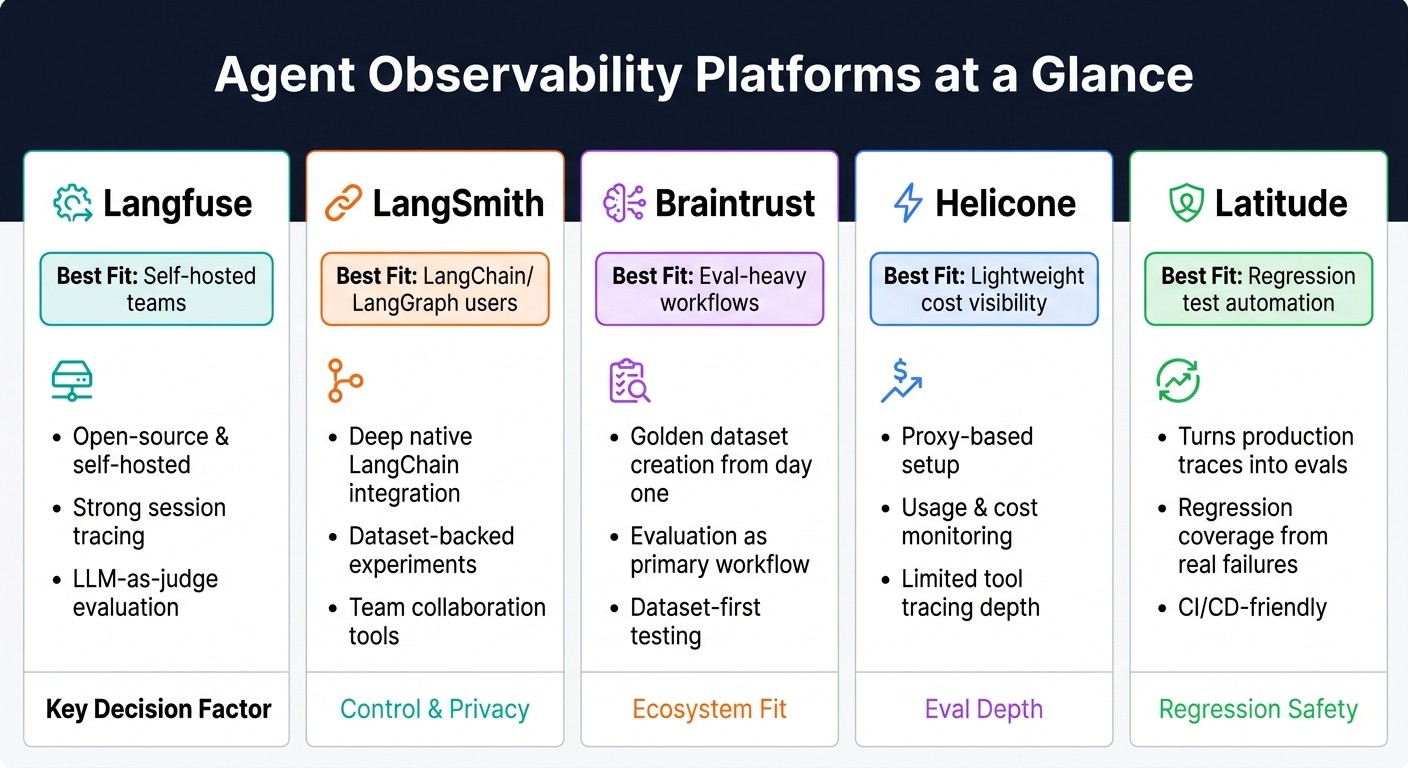
The platform section also has a clear split:
| Tool | Best fit |
|---|---|
| Langfuse | Self-hosted tracing with session support and evals |
| LangSmith | Teams already using LangChain or LangGraph |
| Braintrust | Eval-heavy workflows and dataset-first testing |
| Helicone | Lighter proxy-based usage and cost visibility |
| Latitude | Turning production traces into regression tests |
If I had to sum up the whole article in one line, it would be this: multi-turn agents are only debuggable when traces, IDs, costs, and evals all stay tied to the same conversation.
That’s the frame I’d carry into the rest of the piece.
The core problems in tracing multi-turn conversations
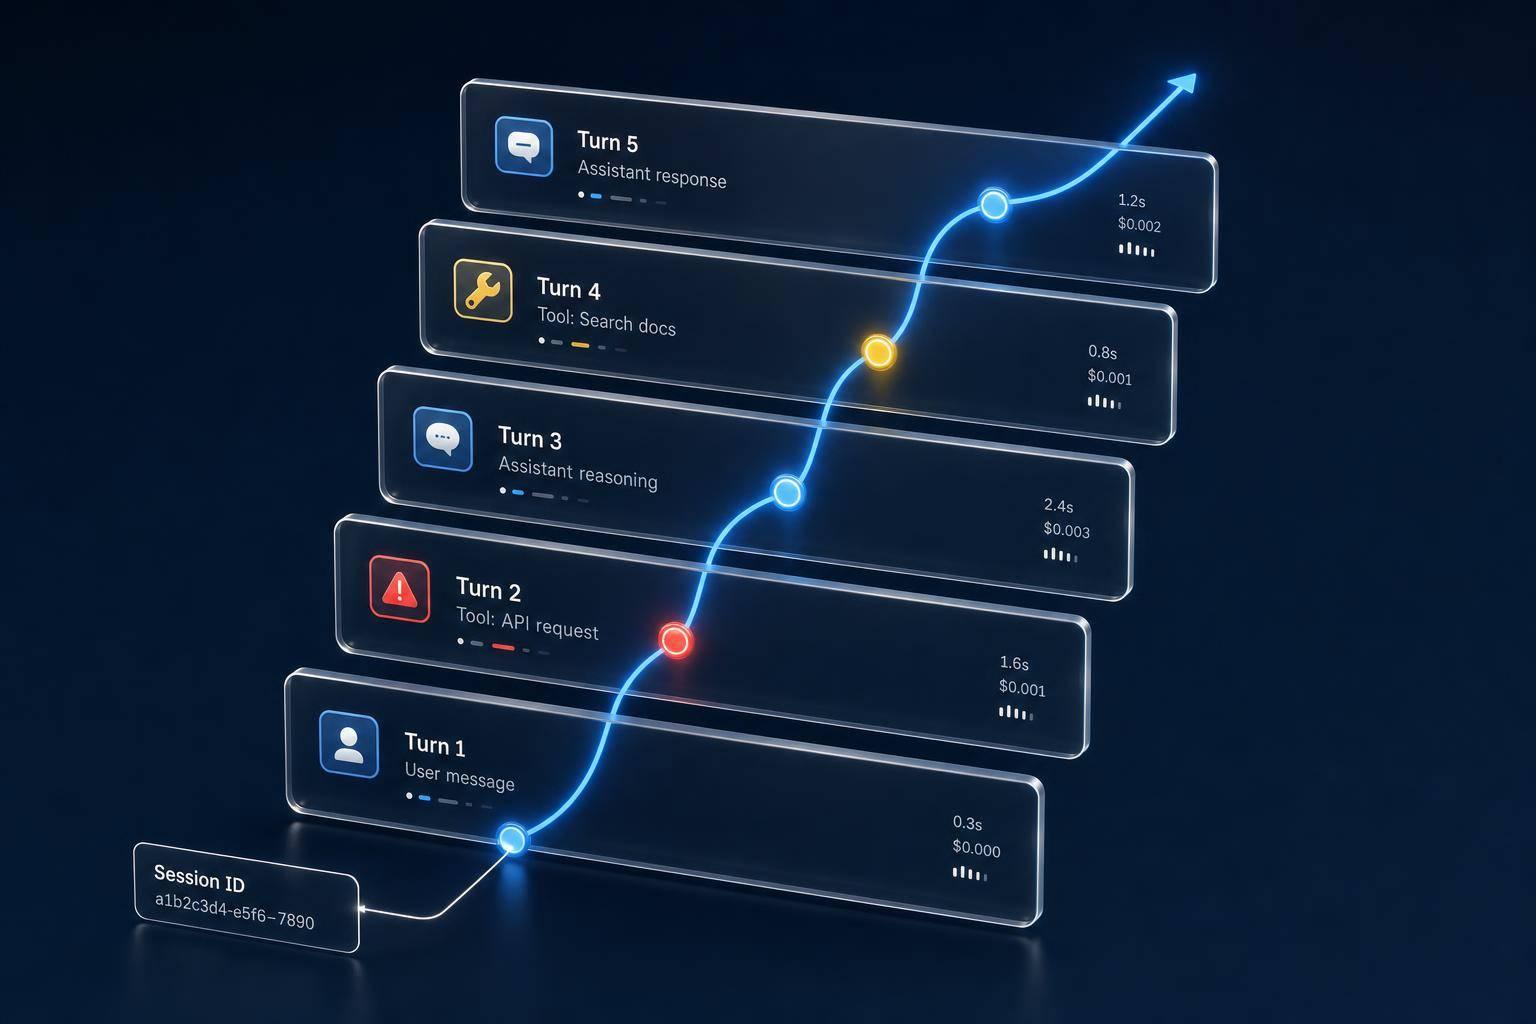
Multi-turn observability is different from single-turn logging for a simple reason: it keeps the session , the cause-and-effect chain, and the cost of the whole conversation in view. When that breaks down, the early warning signs are usually the same: broken lineage, hidden failures, and fuzzy cost attribution.
Fragmented traces, orphaned spans, and missing session context
Without a stable session_id or thread_id, each turn can spin up a new trace and snap the conversation lineage. That leaves you with orphaned spans: tool runs or sub-agent runs that no longer connect back to the root trace. And once that link is gone, rebuilding the full run becomes a headache.
Without parent-child links, you may see that a tool call happened, but not why it happened. The decision that triggered it is missing. At that point, debugging stops being about one bad call and turns into digging through the entire conversation.
Conversation-level failures that turn-level metrics miss
This is where turn-level metrics can give teams a false sense of success. They often miss failures that show up only across the full session, especially context loss and delayed guardrail leakage.
A clean answer on one turn doesn’t mean the conversation went well. One subtle case is delayed prompt-injection leakage: a guardrail may block an injection on turn 3, but the injected instruction can still shape tool calls several turns later, even if the assistant’s text still looks clean.
Why cost and latency are hard to attribute per conversation
Rolling up token usage across a full session is harder than it looks. Every LLM call, tool invocation, and retry adds its own cost, but many logging setups store those as separate per-call totals. So you get a spend number, but not much else. You still can’t tell which session or which node burned through the budget.
Cost is also a correctness signal in multi-turn systems. When an agent gets confused and falls into a retry loop, users feel the drag, and your token bill climbs with it. OpenTelemetry GenAI semantic conventions now standardize attributes like gen_ai.usage.input_tokens and gen_ai.tool.call.id, which makes vendor-agnostic cost tracing possible.
These failures point to instrumentation gaps, which the next section addresses directly.
How to instrument multi-turn traces correctly
Top Agent Observability Platforms Compared: Langfuse vs LangSmith vs Braintrust vs Helicone vs Latitude
Use stable session IDs and a trace model that links every turn to one session
Once you know where multi-turn systems tend to break, the fix is pretty simple: instrument every turn the same way.
Assign a session_id in the frontend, then pass it through every service, worker, and retry. That one step helps prevent orphaned turns and broken conversation lineage. Use trace_id for a single turn and session_id for the whole conversation. On each trace, add tenant_id, prompt_version, and environment so you can later slice failures by cohort or prompt changes.
Put plainly, session IDs connect the conversation , while spans show what happened inside each turn.
Capture spans for LLM calls, tools, retrieval, and guardrails
Model each trace with a root agent span and child spans for LLM calls, tools, retrieval, and guardrails. That makes it much easier to reconstruct the decision path for every turn.
Use OpenTelemetry GenAI fields (gen_ai.*) for portable span metadata. Fields such as gen_ai.operation.name, gen_ai.request.model, gen_ai.usage.input_tokens, gen_ai.conversation.id, and gen_ai.tool.call.id help keep traces portable across tools.
A 30-minute agent run can produce more than 200 individual spans. At that point, old-school tree views get messy fast. It helps to choose a tool with a transcript view, where you can read the conversation like a conversation instead of digging through a deep trace tree.
When to use Langfuse, LangSmith, Braintrust, Helicone, or Latitude
Once the trace model is set, the next step is picking the platform that fits your setup. For multi-turn production systems, the main things to compare are session support, how deep the platform traces agents and tools, and how well it handles evaluation work.
-
Langfuse - a good fit for teams that want open-source, self-hosted control with strong session tracing and LLM-as-judge evaluation.
-
LangSmith - a good fit for teams already using LangChain or LangGraph and needing deep native integration plus dataset-backed experiments.
-
Braintrust - a good fit for teams that treat evaluation as the main workflow and want to build golden datasets from day one.
-
Helicone - a good fit for lightweight cost and usage visibility through a proxy layer, though tool tracing depth is more limited.
-
Latitude - a good fit when the goal is turning production traces into regression tests.
If your main goal is turning production traces into regression tests, Latitude is built for that path. Latitude is useful when you want production failures turned into evals, so trace data becomes regression coverage.
How to evaluate full conversations instead of isolated replies
Tracing gives you the evidence. Evaluation tells you what to do with it. Once your traces are in good shape, the next job is to measure the whole conversation , not just one reply at a time.
Turn-level checks vs. conversation-level success criteria
You need both. Just don’t mix them up.
Turn-level scoring looks at one response on its own. Was the tone right? Was the answer on topic? Did it pass safety checks? This kind of scoring is fast, and it’s usually easy to automate. But it misses a whole class of problems.
Conversation-level scoring looks at the full thread. Did the agent remember what the user said in turn 1 by turn 6? Did it finish the user’s actual task? Did it ask for the same detail twice? A system can do well on each reply and still fail the conversation.
Analysis of 12 million logs found that 78% of production agent failures were silent - hallucinations or lost context that didn’t trigger a traditional error flag. Those failures are much harder to spot if you only check the latest message.
| Dimension | Turn-Level Scoring | Conversation-Level Scoring |
|---|---|---|
| Scope | Single response | Full thread/session |
| What it catches | Bad tone, unsafe content, vague answers | Circular loops, dropped context, contradictions |
| Failure type | Noisy, visible | Silent, cumulative |
If turn scores are high but conversation scores are low, that’s a red flag. The agent sounds right, but it isn’t getting the job done.
Use production traces to build evals that reflect real failures
Start with real sessions. Pull a sample, label the failure patterns you keep seeing, and turn those into eval cases.
When a trace fails, tag it with a clear root cause, like “stale policy retrieval” or “tool-selection drift.” That makes it easier to group similar issues and build tests around them. Put simply: your eval suite should come from what’s breaking in production, not from edge cases someone dreamed up in a planning doc.
That’s how evals stop being theory and start matching actual behavior.
Run regression checks before prompt, model, or workflow changes ship
Once you’ve labeled those failures, keep them as a fixed regression set before release.
Before a prompt edit, model swap, or workflow update goes live, run the new version against the same set of real-session test cases. A change that looks harmless in one reply can throw off behavior across an entire thread. That’s where teams get burned.
It also helps to wire this into your CI/CD pipeline and sample 5–10% of live traffic for live scoring. That way, you’re not just checking before launch. You’re also watching what happens after the change meets actual users.
Operational practices and conclusion
Sampling, retention, and governance for production traces
Once traces start feeding your evals, sampling and retention shape what you can investigate later.
A good starting point is simple: capture 100% of production traffic for the first 30 days. That gives you a clean baseline before you cut sampling. Without that baseline, you’re guessing. And with agents, guessing gets expensive fast because agent traces cost more than standard service traces.
After that, tail-based sampling is usually the better fit for agents than head-based sampling. Head-based sampling can snap causal chains and leave you with orphaned spans that don’t tell the full story. Tail-based sampling keeps the traces you care about most: slow sessions, hallucinations, and loops. Those are often the exact cases random sampling fails to keep.
In practice, the pattern looks like this: keep 100% capture for the first 30 days, then move to tail-based sampling with 30–90 day retention and automated redaction for sensitive data. In healthcare and finance, pre-export redaction is often needed to strip out PHI, payment data, and other sensitive fields before traces leave your infrastructure. It also helps to automate retention policies so a manual mistake doesn’t turn into legal risk.
Connect AI traces to the rest of your observability stack
Trace data gets a lot more useful when it shares IDs with logs, metrics, and infra signals.
Tag every log line, metric, and AI trace with the same session_id or request_id. That way, when an agent fails, you can tie it back to latency spikes, database timeouts, or other infra signals without bouncing between tools. It sounds small, but this is the difference between seeing an error and seeing why it happened.
There’s another wrinkle with agents: cost depends on the conversation itself. That means a spike above 5x the median often points to a retry storm or an infinite reasoning loop, even when a standard error-rate dashboard looks fine.
Key takeaways for tracing multi-turn agents reliably
The core rule is straightforward: keep traces, IDs, and evals tied together.
Multi-turn failures build over time. They’re often quiet, cumulative, and easy to miss if you only watch turn-level metrics. The teams that can debug them well tend to do a few things consistently:
-
Use stable session IDs so every turn stays inside the same trace
-
Instrument the full stack: LLM calls, tools, memory, and guardrails
-
Treat production traces as the main source for building evals
-
Use platforms like Latitude when you need to turn production traces into regression tests
That’s what makes these systems debuggable in practice, not just observable on paper.
FAQs
Why isn’t single-turn logging enough?
Single-turn logging isn’t enough for agents.
Why? Because agent behavior depends on multi-step reasoning , stateful context , and choices made inside the model - not just in your code. A normal log shows one event at a time. But agent failures often show up across several turns or steps.
That’s where things get messy. Problems like context poisoning , tool-selection drift , and memory inconsistencies don’t usually come from one bad action. They build over time. If you only look at isolated logs, you miss the chain of events that caused the failure.
A trace tree helps you see that chain. It shows how each step connects to the next, which makes it much easier to spot where things started to go off course.
Latitude can help track these failure modes and generate automated evaluations.
What should a session-level trace include?
A session-level trace should capture the full conversation state across all turns and tie individual traces together with a shared session_id or thread_id.
That means logging every LLM call, tool invocation, retrieval step, state transition, and decision branch in one connected view. You also want the key metadata for each step: model names, prompt hashes, inputs and outputs, token usage, cost, latency, and error details.
With that setup, Latitude can help surface failure modes and track them as bugs.
How do I turn production failures into evals?
Use a closed-loop system that turns observability into automated testing. Start by recording complete, session-level traces, including internal reasoning, tool calls, and state changes - not just input-output pairs.
Then:
-
observe
-
cluster similar failures
-
annotate failure modes
-
generate reusable test cases
-
run them before deployment
Platforms like Latitude can automate this workflow.