Real-time LLM monitoring requires tracing prompts, tracking latency and token costs, sampling outputs, and alerting on quality drops.

César Miguelañez
Deploying large language models (LLMs) is tricky. Unlike regular software, LLMs can output flawed or irrelevant responses even when everything seems fine on the surface. This makes traditional monitoring tools insufficient. To keep your LLMs reliable and cost-effective, you need a system that tracks not just uptime but also response quality, accuracy, and expenses in real time. Here's how to do it:
Track Key Metrics: Monitor latency, token usage, error rates, hallucination rates, and response relevance to ensure performance and quality.
Set Up Alerts: Use smart alerts for issues like high error rates, rising costs, or poor output quality.
Use Tracing: Implement tools like OpenTelemetry to trace every step of your LLM pipeline, from prompts to final outputs. This requires a solid foundation in prompt engineering for developers to ensure inputs are structured for observability.
Choose the Right Tools: Platforms like Langfuse, Helicone, or Braintrust can simplify monitoring and evaluation.
Optimize Costs: Keep an eye on token usage and set limits to avoid unexpected expenses.
Key Metrics to Track for LLM Monitoring
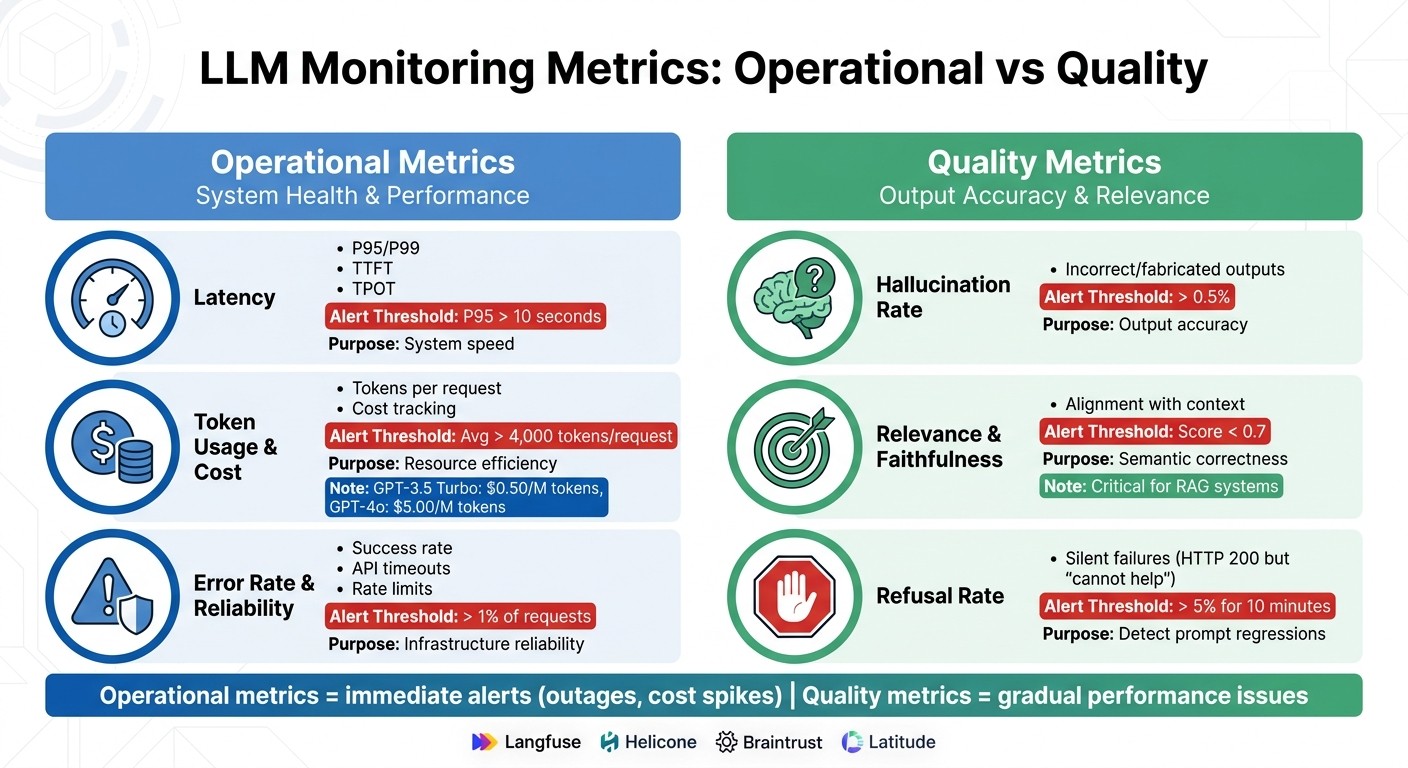
LLM Monitoring Metrics: Operational vs Quality Comparison Guide
Keeping an eye on key metrics is essential when monitoring large language models (LLMs). These metrics fall into two main categories: system health and output quality. System health metrics ensure your infrastructure is running smoothly, while output quality metrics assess whether the model's responses are accurate and helpful. As the Braintrust team puts it:
"Traditional APM metrics indicate whether infrastructure is functioning but reveal nothing about whether an LLM's responses are accurate, relevant, or safe."
This distinction is crucial. An LLM might appear to be running perfectly - minimal latency, no errors - while quietly generating inaccurate or misleading content. Distinguishing between these two types of metrics helps catch issues early and manage costs effectively.
Operational Metrics
Operational metrics focus on the technical performance of the system. Here are the key ones to track:
Latency: This directly impacts user experience. Key indicators include Time to First Token (TTFT), which measures the speed of the initial response, and Time Per Output Token (TPOT), which affects how smoothly streaming responses are delivered. For complex tasks, aim for P95 latency below 10 seconds. Keep in mind that LLM latency often skews heavily - P99 latency can be much higher than the median due to retries or long outputs.
Token Usage: Token consumption drives costs. Monitor the average tokens per request, and set alerts if usage exceeds 4,000 tokens. With pricing ranging from $0.50 per million input tokens for GPT-3.5 Turbo to $5.00 for GPT-4o, even small inefficiencies can become expensive quickly.
Error Rates and Reliability: These metrics help differentiate between infrastructure issues and model-specific problems. Track success rates, API timeouts, and rate limit hits. Alerts should trigger if error rates exceed 1% of total requests. To avoid unnecessary alerts, base thresholds on sustained degradation or service level objective (SLO) burn rates.
Quality Metrics
Quality metrics evaluate how well the model's responses meet user expectations. These include:
Hallucination Rate: This measures the frequency of incorrect or fabricated outputs. Many teams aim for a hallucination rate below 0.5%. Even with a temperature setting of 0, large models can produce varying completions across identical runs. Use tools like LLM-as-a-judge or compare outputs against ground truth to calculate this metric and set alerts for any deviations.
Relevance and Faithfulness: These metrics assess whether responses align with user intent and remain grounded in the provided context. This is especially important for Retrieval-Augmented Generation (RAG) systems, where every claim should be backed by retrieved documents. Evaluating a small percentage (5–15%) of production traffic with an LLM-as-a-judge can provide strong quality signals without excessive costs.
Refusal Rate: Silent failures can occur when the model returns an HTTP 200 status but responds with, "I cannot help with that." This could indicate a prompt regression or a provider policy change. Set alerts if refusal rates exceed 5% for 10 minutes, and always log the specific dated model version (e.g., gpt-4-0613) to track changes from provider updates.
Operational vs. Quality Metrics Comparison
The table below summarizes key operational and quality metrics for easy reference:
Metric Category | Metrics | Purpose | Alert Threshold | Monitoring Tools |
|---|---|---|---|---|
Operational | Latency (P95/P99), TTFT, TPOT, Throughput | System health and speed | P95 > 10 seconds | Langfuse, Helicone, Latitude |
Operational | Token Usage, Cost | Resource efficiency | Avg > 4,000 tokens/request | Braintrust, Latitude |
Operational | Error Rate, Timeouts | Infrastructure reliability | > 1% of requests | Langfuse, Helicone |
Quality | Hallucination Rate | Output accuracy | > 0.5% | Latitude, Braintrust |
Quality | Relevance, Faithfulness | Semantic correctness | Score < 0.7 | Langfuse, Latitude |
Quality | Refusal Rate | Prompt regressions | > 5% for 10 minutes | Latitude, Braintrust |
Operational metrics are ideal for immediate alerts - like service outages or unexpected cost spikes - while quality metrics help identify more gradual performance issues. Comprehensive monitoring should include both types. For example, setting daily spend alerts can prevent runaway loops that generate unexpected charges. Additionally, comparing automated quality scores with human feedback ensures that tools like LLM-as-a-judge stay aligned with user expectations.
Architecture Patterns for Real-Time Monitoring
Once you’ve identified the metrics you want to track, the next step is setting up an architecture that gathers data efficiently without dragging down performance. The choice of architecture depends on factors like your performance requirements, team expertise, and the scale of your infrastructure.
A widely adopted standard for distributed tracing is OpenTelemetry (OTel), which uses GenAI Semantic Conventions (v1.37+) to standardize the capture of prompts, token usage, and model metadata. This approach avoids being locked into a single vendor and enables routing traces to multiple backends, such as Latitude for AI observability or Datadog for infrastructure monitoring.
Sidecar Pattern for Logging
The sidecar pattern involves deploying a secondary container alongside your main application within the same execution environment (e.g., a Kubernetes pod). While the main application handles its core business logic, the sidecar manages tasks like logging, tracing, and proxying. This separation allows you to update or replace the tracing layer without altering your application code.
The sidecar functions as a transparent proxy, intercepting HTTP traffic between your application and the LLM provider. It captures prompts, responses, and token usage. By using frameworks like OpenLLMetry, you can simply point your application’s LLM host to the sidecar’s local address.
The performance impact of a local sidecar is minimal, adding about 0.35 milliseconds of latency. Considering that LLM inference times often range from hundreds of milliseconds to several seconds, this added delay is almost negligible. For even faster communication, you can use Unix domain sockets, which reduce roundtrip time to roughly 10 microseconds.
For teams needing centralized control over traffic from multiple sources, the gateway pattern offers a strong alternative.
Gateway Pattern for Centralized Control
A gateway sits between your application and the LLM provider, intercepting all traffic regardless of its origin within the codebase. Like the sidecar pattern, it ensures thorough data capture for monitoring purposes. This guarantees 100% capture of all requests, making it ideal for scenarios involving multiple LLM providers or the need for rate limiting.
As noted in one analysis:
"A proxy sits between your application and the LLM provider... it adds a network hop to every call, increasing latency by several milliseconds at minimum." - Glassbrain
The additional latency ranges from 5 to 20 milliseconds per call. While this is acceptable for most applications, teams prioritizing speed may prefer SDK wrapping instead.
Many teams are now shifting tracing responsibilities to the gateway layer, using tools like Solo Agentgateway. This allows them to automatically collect data from multiple agents and providers without modifying application code. This setup is particularly useful for multi-agent workflows, where a single user request might trigger a chain of 5–8 LLM calls.
Data Pipeline Design
To maintain fast request-response times, handle logging asynchronously. Use in-memory buffers and batch data transmission in background threads. This ensures dashboards and alerts remain updated in near real-time without slowing down the application.
An OTel Collector can streamline telemetry by distributing a single data stream to multiple backends simultaneously. For instance, you can send traces to Latitude for AI observability and Datadog for infrastructure monitoring - all from one pipeline.
For high-volume systems, trace 10–20% of requests at full fidelity while logging basic metrics for all traffic. This approach helps control storage costs. However, always trace errors by configuring the pipeline to bypass sampling for 4xx/5xx errors, safety-filter blocks, or negative user feedback. This ensures critical issues are never overlooked.
A typical LLM trace ranges from 2 KB to 50 KB, meaning 100,000 daily requests could generate 1 GB to 5 GB of data each day. To manage this, implement retention policies and mask personally identifiable information (PII) at the start of the pipeline. Tools like regex or Google Cloud DLP can help prevent sensitive data from reaching your observability backend.
How to Set Up Real-Time Monitoring: Step-by-Step
To implement a real-time monitoring system for your LLM, follow these steps, building on the identified metrics and architecture patterns.
Instrumenting LLM Calls
Start by wrapping your LLM pipeline with OpenTelemetry GenAI Semantic Conventions (v1.37+). This creates a span-based architecture that tracks every step - retrieval, prompt assembly, model inference, and tool calls - through hierarchical traces.
Make sure to capture key attributes, such as gen_ai.system (your provider), gen_ai.request.model, and gen_ai.usage.input_tokens/output_tokens. Log prompts and completions as span events to better manage large payloads and allow for independent sampling. For workflows involving multiple agents, propagate trace context across service boundaries (e.g., via HTTP or message headers) to maintain a unified execution tree.
Use an OTel Collector to distribute traces to multiple backends - like Latitude for AI observability and Datadog for infrastructure monitoring - through a single pipeline. To balance storage costs, fully trace about 10–20% of requests, while logging basic metrics for all traffic.
Once you’ve set up tracing, the next step is to integrate these signals into your monitoring platform.
Integrating Monitoring Platforms
Several monitoring platforms can help streamline this process:
Langfuse: Known for its tracing and evaluation capabilities, it supports native OTel and offers usage-based pricing, including a free tier.
Helicone: Provides the quickest setup through proxy-based logging, requiring no code changes.
Braintrust: Focuses on evaluation quality and costs $25/month.
LangSmith: Offers tight integration with the LangChain ecosystem for $39/month.
Once your platform is chosen, leverage its native SDKs. For example, Langfuse and Latitude provide Python/TypeScript SDKs that let you add @observe() to functions, automatically generating nested spans. Ensure critical attributes like userId, sessionId, and version are included in every span for precise filtering. While logging, capture 100% of metadata (e.g., latency, token usage) but limit full prompt/response text sampling to 10–25% to manage storage costs.
Creating Dashboards and Alerts
Dashboards are essential for answering key questions: Is the system functioning? Is it fast? Is it cost-effective? Are the correct models being used, and is quality maintained?.
Latency Monitoring: Track P50, P95, and P99 percentiles to identify long-tail delays.
Streaming Applications: Monitor Time-to-First-Token (TTFT) as it impacts perceived responsiveness.
Set up alerts for operational, financial, quality, and safety concerns. Use relative thresholds, like costs doubling compared to the previous day, to account for natural traffic fluctuations. For harder-to-detect issues, such as "silent failures", configure alerts for scenarios where error rates remain low, but quality scores drop below 0.7. Finally, link every alert to a runbook, ensuring your on-call team can quickly address incidents like "hallucination outbreaks".
Alerting and Governance Best Practices
Once you've gathered detailed metrics, the next step is to set up intelligent alerts that turn raw data into actionable steps. Combining these alerts with dashboard visualizations and effective governance ensures you're ready for real-time LLM monitoring, incident management, and regulatory needs.
Configuring Smart Alerts
Effective alerts should focus on sustained issues, like SLO burn rates, rather than one-off spikes.
Organize alerts into three priority levels:
P1 alerts: These are critical and should flag serious issues like outages, error rates exceeding 10%, or costs skyrocketing to more than five times the daily average.
P2 alerts: These mid-level alerts, often sent via Slack or Teams, cover performance concerns such as latency exceeding SLA targets or quality scores dropping by over 10%.
P3 alerts: Reserved for daily reviews, these focus on long-term trends, like token usage patterns or retrieval recall metrics.
Start with broad alert thresholds and refine them as your production data grows. From day one, implement daily spend alerts to catch issues like runaway loops or prompt injection attacks that could lead to massive token generation overnight. To improve accuracy, aggregate alert data over 5- or 15-minute windows for metrics like error rates and latency. Always include metadata and direct links to relevant traces in your monitoring platform for quick troubleshooting.
Building Custom Dashboards
After setting up alerts, use dashboards to visualize performance and trends in real time. Create dashboards that address both technical and business questions. For example, real-time views allow engineers to quickly respond to latency spikes, while long-term trend analysis can uncover gradual performance declines or semantic drift. Dashboards should also let you drill down from high-level metrics into detailed traces, showing every step of the execution path, including retrieval and tool calls.
Tie metrics like cost per task and quality scores directly to user satisfaction. For streaming applications, focus on Time to First Token (TTFT) as a key latency metric to ensure responsiveness. Integrate "thumbs up/down" feedback directly into dashboards so human input aligns with automated quality scores.
Segment data by factors like user tier, region, and prompt version to uncover tailored insights. Well-structured dashboards and alerts also help with cost tracking and quality control. For instance, organizations using integrated AI observability platforms report up to 40% faster production times compared to those relying on disconnected tools. Structured cost management has led teams to identify inefficiencies and cut LLM spending by as much as 90%. Dashboards should also highlight model cost differences, such as the 12× price gap between GPT-4o (around $12.50 per 1K requests) and Claude 3.5 Haiku (about $1.00 per 1K requests).
Governance and Compliance
Governance plays a key role in ensuring compliance and maintaining traceability over the long term. To meet regulations like GDPR and CCPA, mask or hash any PII in stored prompts and responses. Use a prompt_hash to track unique inputs without storing raw data, creating a compliance-friendly audit trail.
Follow OpenTelemetry GenAI Semantic Conventions to standardize metadata. Version every part of your AI stack - such as prompt templates, model versions, retrieval configurations, and evaluation rubrics - so you can trace issues back to specific changes and avoid regressions.
Cost governance is another critical component. Set budgets at user, tenant, and feature levels, and establish both hard limits and soft alerts to prevent runaway costs. Define SLAs for latency and quality, and assign clear ownership through on-call rotations and incident response guides. Tools like Latitude offer features like role-based access control (RBAC) and SOC2 compliance for enterprise teams, along with unlimited annotation queues to streamline human review workflows.
Conclusion
Key Takeaways
Monitoring large language models (LLMs) in real-time is a different game compared to traditional application monitoring. It revolves around four key areas: Tracing (tracking what happened), Metrics (measuring performance), Quality Monitoring (evaluating output), and Alerting (spotting anomalies). Companies using integrated AI observability platforms have reported up to 40% faster time-to-production compared to those relying on scattered tools.
To get started, instrument your LLM calls with OpenTelemetry GenAI Semantic Conventions for flexibility across vendors. Use a tiered logging approach: log metadata for every request while sampling full prompt and response texts for 10–25% of requests. This strikes a balance between cost control and debugging depth. Focus on critical metrics like Time to First Token (TTFT) for streaming apps, token costs per feature, and semantic quality scores - areas where traditional monitoring tools fall short.
Another essential piece is the feedback loop between production traces and evaluation datasets. Structured cost attribution can help you save significantly by identifying inefficiencies like oversized context windows or poorly designed prompts. For instance, a single unoptimized agent loop once caused a $3,200 overnight bill due to a faulty retry mechanism.
Armed with these insights, you’re ready to start applying these strategies in your production environment.
Next Steps
Here’s how to put these takeaways into action. Start by implementing structured logging and performance metrics. Then, layer in automated quality checks and operational governance, including SLAs and runbooks. Choose tools that align with your workflow - consider Langfuse for open-source tracing, Braintrust for in-depth evaluation, or Helicone for quick proxy-based setups.
For teams managing production LLMs, platforms like Latitude offer comprehensive observability. They provide features such as automatic evaluation generation from real production issues, unlimited annotation queues for human review, and enterprise-grade options like RBAC and SOC2 compliance. Start small: add instrumentation gradually and let real-world production data guide your monitoring strategy. The ultimate goal isn’t just to gather data - it’s to uncover and address potential problems before they escalate into costly incidents.
FAQs
How do I measure hallucinations in production?
To keep track of hallucinations in production, focus on quality metrics that highlight confidently incorrect or irrelevant responses. Key areas to monitor include hallucination rates, relevance, accuracy, and confidence scores. These can be assessed through a mix of automated evaluations and human reviews.
Consider setting up dashboards to visualize trends in real-time and receive alerts when thresholds are crossed. This kind of continuous monitoring allows you to quickly spot and address issues, ensuring the model performs better in production environments.
What should I log without storing user data?
To keep tabs on and troubleshoot your LLM system while safeguarding user privacy, track metrics such as request IDs, prompt types, model calls, response times, token counts, and output quality. Prioritize internal traces, latency, token usage, and success or failure statuses. Make sure to avoid logging any personally identifiable or sensitive user data. This approach allows for effective system monitoring without putting user privacy at risk.
How do I trace multi-step agent workflows end-to-end?
To follow multi-step agent workflows from start to finish, use session-level trace capture. This method records every part of the interaction - reasoning processes, tool calls, and intermediate outputs. By doing so, you can spot problems like state corruption, silent tool failures, or deviations in the workflow path. Tools such as Latitude can simplify trace collection by automating the process. They also transform production failures into regression tests, creating a feedback loop from production to evaluation. This approach makes debugging easier and helps prevent future failures.


