
When deploying large language models (LLMs) in production, containerization with Docker ensures consistent environments, efficient resource management, and smoother scaling. This guide walks you through the entire process - from setup to deployment - helping you avoid common pitfalls like mismatched dependencies or GPU memory issues. Here’s a quick summary of what you’ll learn:
-
Why Use Docker for LLMs : Solve environment mismatches, allocate GPU memory precisely, and streamline scaling with Kubernetes.
-
Setup Essentials : Verify hardware (NVIDIA GPU with compute capability 7.0+), install Docker 24.0+, and configure the NVIDIA Container Toolkit.
-
Building Optimized Docker Images : Use pinned base images, multi-stage builds, and GPU-enabled configurations to create lean, reliable containers.
-
Testing and Validation : Perform inference tests, monitor metrics like Time to First Token (TTFT), and stress-test for high-concurrency scenarios.
-
Performance Optimization : Reduce image sizes, enable model-specific accelerations like quantization, and fine-tune GPU memory utilization.
-
Scaling and Deployment : Use Kubernetes with tools like KEDA for queue-based autoscaling, and set health checks to handle model loading delays.
-
Security Practices : Run containers as non-root users, use Docker secrets for credentials, and scan for vulnerabilities with tools like Trivy.
This checklist ensures your LLM workloads are production-ready, scalable, and secure, addressing challenges like resource hogging, long startup times, and dependency conflicts.
Environment Setup Prerequisites
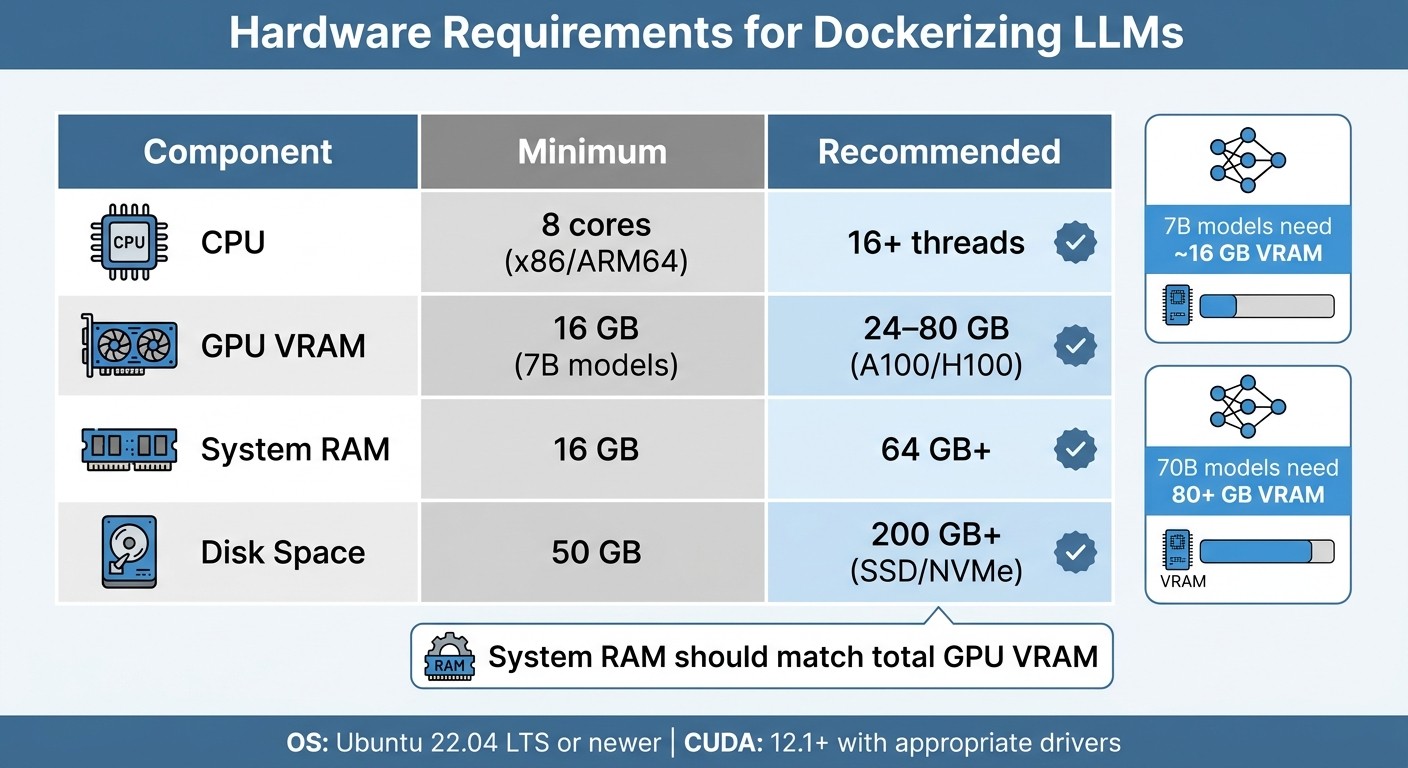
LLM Docker Hardware Requirements: Minimum vs Recommended Specifications
Before diving in, make sure your hardware and software are ready to handle the tasks at hand. Proper preparation can save you from early errors and ensure a smoother experience when building Docker images.
Check System Requirements and Compare Top Models
To get started, you’ll need an NVIDIA GPU with a compute capability of 7.0 or higher (e.g., V100, T4, A10, A100, or H100). If you’re planning to use bfloat16, the minimum requirement increases to a compute capability of 8.0 or higher. You can check your GPU specs, VRAM, and CUDA version by running nvidia-smi on your machine.
For GPU memory, here’s a general guideline: 7B models need approximately 16 GB of VRAM , while 70B models may require over 80 GB. Additionally, your system RAM should match your total GPU VRAM. For example, using an A100 with 80 GB VRAM means you should aim for at least 64 GB of system RAM. Disk space is another critical factor - reserve at least 50 GB , though 200 GB or more is recommended if you’ll be caching large model weights.
| Component | Minimum | Recommended |
|---|---|---|
| CPU | 8 cores (x86/ARM64) | 16+ threads |
| GPU VRAM | 16 GB (7B models) | 24–80 GB (A100/H100) |
| System RAM | 16 GB | 64 GB+ |
| Disk Space | 50 GB | 200 GB+ (SSD/NVMe) |
Your operating system should be Ubuntu 22.04 LTS or newer, as it’s the most validated for handling LLM workloads. Make sure your system’s glibc version is 2.35 or higher. For CUDA, you’ll need the following driver versions based on your CUDA version:
-
Driver 525+ for CUDA 12.1
-
Driver 550+ for CUDA 12.4
-
Driver 580+ for CUDA 12.9
Once your hardware checks out, you’re ready to tackle the software setup.
Install Required Tools and Libraries
Start by installing Docker Engine 24.0+. Next, set up the NVIDIA Container Toolkit , which connects Docker to your GPU. Install version 1.14.0 or later , then configure it with:
sudo nvidia-ctk runtime configure --runtime=dockerRestart the Docker daemon and confirm everything is working by running:
docker run --rm --gpus all nvidia/cuda:12.1.0-base-ubuntu22.04 nvidia-smiFor inference frameworks, consider using vLLM or Text Generation Inference(TGI) , both popular choices for production workloads. Your Python environment should be set to version 3.10 or 3.11 , managed via pip within the container. Core libraries to install include:
-
Hugging Face’s
transformers -
torch(PyTorch) -
accelerate -
sentencepiece
If you’re building APIs, frameworks like FastAPI or Flask are great options. For interactive UI development, check out Gradio.
When configuring Docker, set --shm-size to 16 GB for a single GPU or 32 GB for multi-GPU systems to avoid tensor operation crashes. To persist model weights, mount a volume like this:
-v ~/.cache/huggingface:/root/.cache/huggingfaceWith these steps completed, your environment is ready for building optimized Docker images.
Building an Optimized Docker Image
Creating an efficient, production-ready Docker image isn’t just about functionality - it’s about making smart choices that influence performance, security, and deployment speed. From the base image to dependency management, every detail matters.
Select the Right Base Image
Start by picking a base image that suits your needs. For vLLM serving , go with vllm/vllm-openai:v0.6.0. If you’re using Text Generation Inference , the ideal choice is ghcr.io/huggingface/text-generation-inference:2.3.0. For custom development, consider nvidia/cuda:12.1.0-cudnn8-devel-ubuntu22.04 for the full CUDA toolkit or nvidia/cuda:12.1.0-runtime-ubuntu22.04 for a more lightweight runtime environment.
Always pin your image versions. Using specific tags like vllm/vllm-openai:v0.6.0 ensures stability, as relying on :latest could lead to unexpected failures if breaking changes are introduced. Also, make sure your container’s CUDA version aligns with your host’s NVIDIA driver. For example, CUDA 12.1 requires driver 525.60+ while CUDA 12.4 needs 550.54+.
For Python-only workloads without GPU needs, python:3.12-slim is a solid option. While Alpine images are smaller (about 5MB compared to Ubuntu’s 70MB+), they use musl instead of glibc, which can cause compatibility issues with Python binaries and popular machine learning libraries. If you’re working with frameworks like PyTorch or Transformers, stick with Debian-based slim images for better reliability.
Configure Dependencies and Code
When writing your Dockerfile, structure it to maximize efficiency. Place static instructions (like base image selection and system package installation) at the top, and save frequently changing steps (like copying source code) for later. This setup speeds up builds in CI/CD pipelines.
Use multi-stage builds to keep your final image lean. Start with a “builder” stage using -devel images to install heavy tools like gcc and python3-dev. Then, copy only the essential binaries into a separate production stage. This strategy can shrink your image size by as much as 60–80%.
To ensure consistent builds, pin all dependency versions in your requirements.txt (e.g., transformers==4.31.0). Add the --no-cache-dir flag when using pip to avoid storing unnecessary cache files, which can save hundreds of megabytes. If GPU support isn’t needed, install CPU-specific packages via --extra-index-url https://download.pytorch.org/whl/cpu to avoid pulling large CUDA binaries.
Don’t forget a .dockerignore file to exclude files like .git, __pycache__, and .env. This not only speeds up builds but also prevents accidental exposure of sensitive information. Minimize image size further by chaining cleanup commands after installing packages (e.g., rm -rf /var/lib/apt/lists/*). For added security, create a non-root user (e.g., llmuser) and switch to it with USER llmuser before running your application.
Once dependencies are in place, you’re ready to enable GPU support for your container.
Enable GPU Access
To ensure GPU access, run the test command mentioned in the environment setup section.
When launching your container, use --gpus all to enable GPU usage (or --gpus '"device=0,1"' to specify particular GPUs). Allocate shared memory with --shm-size 16g for single-GPU workloads or 32g for multi-GPU setups. Shared memory is crucial for tensor operations in engines like vLLM, and insufficient allocation can cause crashes under heavy load. For multi-GPU configurations, include --ipc=host to enable faster GPU-to-GPU communication using NCCL.
To persist model weights between container restarts, mount your model cache as a volume:
-v ~/.cache/huggingface:/root/.cache/huggingfaceSet --gpu-memory-utilization to 0.90 to manage memory usage effectively. Going beyond 0.95 can lead to Out-of-Memory errors during high traffic. For larger models (70B+), adjust the health check start_period to at least 120–300 seconds to accommodate the time needed to load weights into VRAM, which can take several minutes.
Testing and Validating the Container
Once you’ve optimized your image and configured GPU settings, it’s time to validate the container before deploying it to production.
Run Unit Tests for Inference
Begin by ensuring the model loads correctly and delivers accurate outputs. Use health endpoints like /health and /health/ready to confirm the inference engine is active and that the model has fully loaded into VRAM.
Perform a basic inference test using cURL or an OpenAI-compatible SDK to check if the model generates the expected text or structured outputs. Pay attention to two key performance metrics: Time to First Token (TTFT) , which measures responsiveness, and Time Per Output Token (TPOT) , which tracks generation speed. If your p99 TTFT exceeds 5 seconds or p99 TPOT is over 0.1 seconds, consider adjusting memory allocation or tweaking GPU settings.
For agentic workloads, evaluate tool-calling accuracy by simulating multi-step agent loops (up to 5 rounds). This helps confirm the model can handle tool chains without errors. For instance, in tool-calling tests, Qwen 3 (14B) achieved a 0.971 F1 score, closely matching GPT-4’s 0.974.
Perform Load and Stress Testing
To simulate real-world usage, test the container’s ability to handle concurrent traffic. Monitor GPU memory usage and KV cache metrics like vllm:gpu_cache_usage_perc. If this exceeds 95%, you risk running into Out-of-Memory errors. Keep an eye on vllm:num_requests_waiting - a queue depth exceeding 100 requests indicates capacity issues.
Use docker stats to observe CPU, memory, and GPU utilization in real time. For multi-GPU setups or high-concurrency scenarios, set --shm-size to at least 16–32 GB to avoid crashes during tensor operations. Leverage vLLM’s PagedAttention to reduce memory waste from 60–80% down to under 4%, and note that TGI v3 can deliver up to 13x faster performance than vLLM for long-prompt tasks.
After completing stress tests, ensure the container environment remains stable and consistent across different deployments.
Verify Environment Consistency
Maintaining consistency in dependencies and settings is essential after validation. Use pinned image versions (e.g., vllm/vllm-openai:v0.6.0) rather than :latest, which can introduce unexpected changes. This ensures identical environments across development, staging, and production.
Incorporate smoke tests into your CI/CD pipeline using tools like GitHub Actions. These automated tests help verify image integrity and prevent regressions, ensuring your LLM application behaves predictably at every stage of deployment.
Optimizing Performance and Scalability
Once functionality checks out, the next step is all about fine-tuning performance and preparing for scalable deployments that can handle production demands.
Reduce Image Size
Start by using a lightweight base image like python:3.9-slim or debian-slim to cut down on unnecessary overhead. For GPU workloads, stick to runtime variants instead of devel variants to avoid bundling extra compilers or tools. Multi-stage builds can also help by separating the build environment from the final runtime image, which shrinks the image size even further. For instance, ONNX with int8 quantization can slash Docker image sizes by up to 10× - from 7.05 GB to just 699 MB. Additionally, combining RUN instructions in your Dockerfile reduces layers, helping to keep the image compact.
Enable Model-Specific Accelerations
Performance can be significantly boosted with model-specific tweaks. For example, PagedAttention - used by vLLM - treats the KV cache like virtual memory pages, cutting memory waste from 60–80% to under 4%. Continuous batching is another game-changer, allowing new requests to join active batches mid-inference. This approach can reduce per-token costs by up to 85%.
Quantization techniques like AWQ, GPTQ, or INT4 can also work wonders. These methods reduce a 70B model’s memory needs by about 75%, bringing them down from 140 GB to just 40 GB, with only minor accuracy trade-offs. For models that don’t fit within a single GPU’s VRAM, the --tensor-parallel-size flag lets you distribute layers across multiple GPUs. To maximize throughput, set --gpu-memory-utilization between 0.85 and 0.90, leaving a 10–15% buffer for CUDA overhead. Finally, always use --ipc=host in multi-GPU setups to enable faster GPU-to-GPU communication via NCCL.
Once these optimizations are in place, you’ll be better equipped to handle higher workloads efficiently.
Scale Workloads Effectively
Scaling for LLMs requires a different approach than traditional methods. Kubernetes’ Horizontal Pod Autoscaler (HPA), which relies on CPU or memory metrics, often falls short since GPU utilization can stay at 100%, even when workload efficiency varies. Instead, tools like KEDA can scale based on inference queue depth. For example, metrics like vllm:num_requests_waiting are more reliable for driving scaling decisions.
Avoid scaling down to zero. Always set minReplicaCount to at least 1, as reloading large model weights into GPU memory can take 5–20 minutes. To prevent unnecessary pod shutdowns during temporary traffic dips, set a cooldown period of about 300 seconds.
A real-world example of this in action: In 2024, Stripe used vLLM to manage 50 million daily API calls. By implementing PagedAttention, they reduced their GPU fleet by two-thirds, cutting inference costs by 73%. This highlights the massive efficiency gains possible with the right scaling strategies.
Deploying LLM Containers to Production
Once you’ve optimized your container and tested it thoroughly, the next step is navigating the specific challenges of deploying LLM containers in a production environment.
Container Orchestration
For local setups, Docker Compose might suffice, but production demands more robust orchestration tools like Kubernetes. Kubernetes excels at scaling LLM containers across multiple nodes, especially when managing GPU resources and variable traffic loads.
If you’re handling 10 or more models across teams, KServe can simplify deployment complexities. Since becoming a CNCF Incubating project in November 2025, KServe has matured into a reliable governance layer for managing intricate model deployments. To ensure efficient GPU scheduling, use the NVIDIA Device Plugin , and for multi-tenant environments, consider Multi-Instance GPU (MIG) for hardware-level isolation. However, note that MIG may not work with certain cloud autoscalers, such as Azure’s AKS.
Scaling LLM workloads also requires a different approach. Traditional Horizontal Pod Autoscaler (HPA) metrics like CPU or memory usage aren’t ideal because GPUs often run at full capacity regardless of workload efficiency. Instead, Kubernetes Event-Driven Autoscaling (KEDA) is a better fit, allowing scaling based on inference queue depth. Metrics like "vllm:num_requests_waiting" provide more accurate insights. To avoid inefficiencies like thrashing, set a cooldown period of at least 300 seconds, as loading model weights can take 5–20 minutes.
“The standard Kubernetes playbook doesn’t transfer cleanly to LLM workloads. The resource model is different, the startup characteristics are different, and the autoscaling signals you’ve been using for stateless web services will actively mislead you here.” – Zartis Team
To prevent unexpected crashes, two configurations are crucial. First, allocate sufficient shared memory (e.g., --shm-size 16 GB or 32 GB for multi-GPU setups) and enable host IPC if tensor operations require it. Second, set health checks with an initial delay of at least 300 seconds to accommodate model weight loading. Additionally, use PersistentVolumeClaims with ReadWriteMany access modes to share model weights across replicas and minimize redundant downloads.
Once your orchestration setup is complete, the next priority is monitoring to ensure consistent production performance.
Monitoring and Observability
LLM containers require deeper observability than standard applications. While Prometheus and Grafana are excellent for general monitoring, you’ll need to track LLM-specific metrics, such as:
-
“vllm:gpu_cache_usage_perc” : Set alerts if usage exceeds 95%.
-
“vllm:num_requests_waiting” : A rising trend could indicate capacity issues.
-
“vllm:time_to_first_token_seconds” : Aim for a p99 latency of under 5 seconds to maintain user satisfaction.
For request-level tracing, tools like Langfuse or OpenTelemetry are invaluable. Platforms like Latitude can also help you observe model behavior, gather human feedback, and run evaluations to catch regressions early.
Key production benchmarks to target include:
-
Time to First Token (TTFT) : Under 500 ms for chat apps or under 5 seconds for retrieval-augmented generation.
-
Time Per Output Token (TPOT) : Less than 50 ms per token.
-
Sustained GPU Utilization : Aim for 60–80%.
-
KV Cache Utilization : Keep usage below 85%.
-
Queue Depth : Maintain fewer than 10 waiting requests.
Finally, configure your ingress controllers with a proxy-read-timeout of 300–600 seconds to accommodate the longer processing times typical of LLM generations.
Continuous Integration and Deployment
With orchestration and monitoring in place, automating your builds and deployments ensures a streamlined and reliable production workflow.
Automate builds using Docker Buildx with layer caching (e.g., type=gha in GitHub Actions) to reduce build times for large CUDA images. Multi-stage builds can help keep images lean by separating build-time dependencies from the runtime environment, often cutting image sizes by 60–90%. Always pin image versions instead of using :latest to maintain reproducibility.
Incorporate automated security scans into your CI/CD pipeline with tools like Trivy , Snyk, or Docker Scout to identify vulnerabilities in base images. Add smoke tests to confirm container startup and API responsiveness, inference validation with tools like pytest to ensure correct outputs, and load tests to simulate peak traffic and catch memory issues before deployment.
For rolling out updates, Kubernetes rolling updates or canary deployments allow you to shift traffic gradually after passing health checks. To avoid delays during scaling, consider baking model weights directly into the Docker image.
“Docker gives you environment parity across dev, staging, and production. You define dependencies once and they stay consistent.” – PremAI
Security and Best Practices
When deploying containers in production, ensuring their security is just as important as optimizing performance. Vulnerabilities in containers for large language models (LLMs) can put your entire infrastructure at risk. Shockingly, studies reveal that 80–95% of AI-generated Dockerfiles fail at least one critical security check , and fewer than 5% include measures like image digest pinning.
“The issue is that developers who would never manually write an insecure Dockerfile will accept an AI-generated one without the same scrutiny, because the AI is perceived as an authority” – redteams.ai
Common Vulnerabilities and Solutions
One of the most frequent issues is root execution. Containers typically run as root by default, which can lead to serious security breaches if a kernel exploit or container escape occurs. To mitigate this, always:
-
Include a
USERdirective to run applications as an unprivileged user. -
Avoid mounting
/var/run/docker.sockinto containers. Doing so grants unrestricted root access to the host.
“Giving someone access to [the Docker socket] is equivalent to giving unrestricted root access to your host” – OWASP
Another major risk comes from embedding API keys or tokens in image layers using ENV or ARG. This practice permanently exposes secrets. Instead, use Docker BuildKit’s secret mounts (e.g., --mount=type=secret) to securely handle sensitive information during builds. Once your container is secured, you can manage API access to interact with your models.
Strengthening Runtime Security
Beyond build-time precautions, runtime security is equally crucial. To protect your containers:
-
Use a read-only root filesystem to prevent unauthorized modifications.
-
Remove unnecessary Linux capabilities with
--cap-drop=ALL. -
Set strict CPU and memory limits to prevent resource exhaustion, which could destabilize the host or lead to denial-of-service attacks.
Automated tools like Trivy , Hadolint, or Checkov can help identify vulnerabilities early. Integrate these tools into your CI/CD pipeline to catch issues before deployment.
Comparison of Common Practices
The table below outlines various security practices, along with their advantages, disadvantages, and best use cases.
| Practice | Pros | Cons | When to Use |
|---|---|---|---|
| Multi-stage builds | Reduces image size by 60–90% and removes build-time secrets/tools | Adds complexity to Dockerfile structure | Ideal for production deployments with large LLM stacks |
| Volume mounts | Allows faster updates without rebuilding; avoids re-downloading large weights | Requires external dependency management and host access | Best for development environments or massive models |
| Baked-in models | Portable and self-contained; ensures faster startup in air-gapped setups | Results in large image sizes and a rigid update process | Suitable for air-gapped production or when model stability is a priority |
| Docker Secrets | Securely injects credentials at runtime without leaving traces | Kubernetes secrets are preferred for Kubernetes-based deployments | Use in Docker Swarm or standalone production setups |
Conclusion and Final Checklist
Dockerizing LLM workloads changes the game for deploying and scaling AI applications. By using containers, you can ensure consistency between development and production environments, avoid the dreaded “it works on my machine” issues, and scale efficiently. As highlighted in the PremAI Production Guide:
“Getting an LLM running in a container takes maybe 20 minutes. Getting it to stay running under real traffic, survive restarts, and give your ops team something to monitor takes a lot longer”.
Key Takeaways
Containerizing LLMs addresses many common production challenges. The primary benefits include reliability, performance, and scalability. For example:
-
Memory efficiency : vLLM’s PagedAttention algorithm reduces memory waste from 60–80% to under 4% and can increase throughput by up to 24x compared to standard HuggingFace Transformers.
-
Speed : TGI v3, with chunked prefill, processes workloads with very long prompts up to 13x faster than vLLM.
-
Resource optimization : Quantization methods like INT4 can lower VRAM requirements by 75%, enabling an 8B parameter model to run on just 6GB of memory instead of 16GB.
Containers also ensure operational consistency. Using volume mounts for model weights avoids re-downloading large files (14GB to over 100GB) with every restart. Stateless designs enable seamless pod replacements without data loss, and carefully timed health checks (120–300 seconds) account for the time needed to load large models into VRAM.
Final Checklist for Dockerizing LLMs
Here’s a handy checklist to confirm your setup is production-ready:
Environment & Setup:
-
Confirm that the host NVIDIA driver matches the container’s CUDA version (e.g., CUDA 12.1 needs driver 525.60+).
-
Use specific image tags like
vllm/vllm-openai:v0.6.0instead of:latestto avoid unexpected updates. -
Mount the model cache as a volume (e.g.,
~/.cache/huggingface) to save time and bandwidth.
Resource Configuration:
-
Adjust GPU settings:
-
Set
--shm-sizeto 16GB for single-GPU or 32GB for multi-GPU setups, or use--ipc=hostto prevent IPC crashes. -
Configure
--gpu-memory-utilization(e.g., 0.90 or 0.85 for bursty traffic) to leave headroom for CUDA contexts. -
Match
--tensor-parallel-sizeto the number of available GPUs.
-
Performance & Monitoring:
-
Track Time to First Token (TTFT) as a key metric for user experience.
-
Set health checks with a
start_periodof 120–300 seconds to allow for model loading delays. -
Scale based on queue depth (e.g.,
vllm:num_requests_waiting) rather than just CPU or RAM usage.
Security Hardening:
-
Run containers as a non-root user by specifying the
USERdirective. -
Use Docker secrets or
.envfiles to handle API tokens securely instead of hardcoding them in Dockerfiles. -
Implement multi-stage builds to create lean, production-ready images.
For ongoing optimization and feedback, platforms like Latitude (https://latitude.so) can be a valuable resource for managing and improving your containerized LLM applications.
FAQs
How do I choose between vLLM and TGI for my use case?
When deciding between the two, it all comes down to what you need. vLLM is a great fit for production setups where speed and efficiency are critical. Its use of optimizations like PagedAttention ensures high throughput and low latency, making it ideal for scaling up. On the other hand, TGI is better suited for smaller projects or research purposes, offering more flexibility and room for experimentation rather than focusing on production-level performance. If your priority is speed and scalability, go with vLLM. But if you’re working on prototypes or testing various models, TGI might be a better choice.
What’s the simplest way to estimate VRAM needs before deploying a model?
To figure out how much VRAM you’ll need, start by looking at the model’s context size. The bigger the context, the more memory it demands. On average, every extra 1,000 tokens uses about 100–500 MB of VRAM. For instance, a context size of 8,192 tokens might consume approximately 0.8–4 GB of VRAM. To estimate, simply multiply your desired context size (in thousands of tokens) by the VRAM usage per 1,000 tokens. This will give you a ballpark figure for your VRAM requirements.
How can I autoscale LLM pods when CPU metrics don’t reflect load?
To manage autoscaling for LLM pods effectively, prioritize metrics such as queue depth , in-flight requests , or request latency. These provide a clearer picture of the workload compared to CPU usage, which can be misleading due to I/O-bound operations. Tools like Kubernetes HPA or KEDA can leverage these metrics for dynamic scaling, helping to meet demand proactively and avoid latency problems. For precise monitoring, rely on model-specific or inference gateway metrics tailored to your workload.