
How to track recurring LLM failures over time
Track a recurring LLM failure as a versioned behavioral issue with a stable definition, detector, evidence, owner, lifecycle, and occurrence history. A trace records one event. A durable failure object determines which variable outputs belong to the same pattern, measures its rate and affected users, and preserves the issue after resolution so its return is recognized as a regression.
The goal is to keep the pattern’s meaning stable while prompts, models, traffic, and releases change around it.
What counts as the same recurring failure?
Two outputs belong to the same recurring failure when they cross the same behavioral boundary and need the same remediation, even if their wording differs.
Consider a retail agent that promises an ineligible return. One response may say “I have issued your refund.” Another may ask the user to ship the wrong item. String matching sees separate messages. A behavioral definition can group both when the agent made a return decision without checking order status, item identity, customer confirmation, or the allowed refund method.
The remediation boundary keeps a failure useful. If two similar-looking traces require different owners or code changes, split them. Semantic similarity helps find candidate groups, but similarity does not establish a shared root cause.
What should the failure object store?
The following is a recommended application schema for a durable failure object. It combines operational records a team should preserve with fields a monitoring product may expose. It is not a claim that every field is a first-class Latitude Signal property.
| Field | Purpose | Example |
|---|---|---|
| Stable ID and name | Preserve identity across releases | return-eligibility-mishandled |
| Behavioral definition | State what belongs in the pattern | Return decision lacks required policy grounding |
| Matching and boundary examples | Calibrate inclusion and exclusion | Valid refund, wrong item, missing confirmation |
| Detector and version | Make changes to matching logic auditable | Conditions v3 or LLM judge v5 |
| Owner, priority, and severity | Route action | Support-agent team, high priority |
| Lifecycle state | Preserve investigation history | New, ongoing, resolved, regressed |
| First and last occurrence | Establish chronology | First seen July 7, last seen July 20 |
| Count, rate, and denominator | Separate volume from prevalence | 12 of 300 eligible sessions, 4% |
| Affected users or sessions | Measure blast radius | 6 users across 12 sessions |
| Release and model context | Localize concentration | release a91c2f, model version x |
| Evaluator alignment | Expose boundary quality | 92% agreement on reviewed examples |
| Representative traces | Preserve concrete evidence | Trace IDs linked to the issue |
| Dataset, test, and fix | Preserve prevention evidence | Regression cases and linked PR |
A saved query, a semantic cluster, an evaluator, and a durable issue each contribute something different. The query retrieves evidence. A cluster suggests a candidate pattern. The evaluator decides membership. The durable issue stores the long-horizon identity, lifecycle, impact, and linked prevention work.
What evidence should you capture for every occurrence?
OpenTelemetry defines a trace as the path of a request through an application and spans as the units of work inside it. For an AI agent, capture the following where available, while separating standardized telemetry from application-specific metadata:
- trace and session or conversation identifiers
- service and deployment version
- environment and release
- prompt name and version
- requested and returned model
- provider
- tool names, call IDs, arguments, results, and errors
- retrieved context and retrieval metadata where relevant
- user or privacy-safe user identifier
- evaluator name, score, and detector version
- user feedback and human annotations
The OpenTelemetry GenAI semantic conventions define many of these attributes, including prompt version, request and response models, conversation ID, tool calls, retrieval data, and evaluation scores. Those conventions are currently labeled Development, so check the current spec and expect instrumentation differences between SDKs.
Prompt content, retrieval text, tool arguments, and user identifiers may contain sensitive data. Add redaction, retention, consent, and access controls before collecting full content. A complete debugging record is useful only when it is safe to keep.
When should you use exact rules, semantic grouping, an LLM judge, or human review?
| Method | Use it when | Strength | Main failure mode |
|---|---|---|---|
| Exact deterministic signature | Error code, schema violation, failed tool, regex, or threshold | Cheap, explainable, repeatable | Misses paraphrases and semantic variation |
| Semantic grouping | Discovering related intents or behaviors across variable text | Finds candidate families at scale | Can merge nearby but operationally different issues |
| LLM judge | The boundary depends on meaning, resolution, tone, or groundedness | Applies a rubric across variable outputs | Cost, nondeterminism, bias, and boundary drift |
| Human review | Ambiguous boundaries, calibration, or high-severity decisions | Highest contextual judgment | Slow and inconsistent without a rubric |
| Custom script | Multi-condition business logic or tool state | Exact application-specific behavior | Maintenance and hidden assumptions |
Use exact checks whenever the fact can be expressed directly. Use semantic grouping to discover candidate families. Then define an evaluator for the actionable behavior instead of treating a cluster boundary as truth. Human reviewers should inspect disputed matches and nearby examples the detector rejected.
At Latitude, Gerard Sans describes a Signal as the object that can track a pattern “over a large data corpus and long time horizon.” That distinction is useful beyond any product: preserve the issue’s definition and history instead of rebuilding it from search results during every incident.
How do you stop an evaluator from becoming too broad or too narrow?
A broad evaluator merges unrelated problems. Review its positive matches across intents, releases, models, and cohorts. If the same label points to different fixes or owners, narrow the rubric or split the issue.
A narrow evaluator fragments one behavior into several trends. Sample semantically nearby traces the evaluator rejected. Add varied positive examples and remove wording that describes one implementation rather than the behavior.
Track the evaluator version alongside the metric. When the definition changes materially, backfill the historical series or mark a break. An uninterrupted chart is misleading when the matching rule changed halfway through it.
Calibration should include:
- reviewed true positives
- reviewed false positives
- nearby rejected examples
- positive and negative boundary cases
- disagreement by release, model, intent, and cohort
- the detector version, scope, and sampling policy
No universal evaluator-accuracy threshold fits every behavior. High-severity failures need more human review than low-risk product-quality issues.
Which metrics show whether the pattern is getting better?
Always pair volume with prevalence.
| Metric | Formula | What it tells you |
|---|---|---|
| Occurrence count | matched occurrences in the window | Investigation volume |
| Occurrence rate | matched eligible sessions / eligible sessions | Prevalence despite traffic changes |
| Affected-user count | distinct users with at least one match | Human or account blast radius |
| Affected-user rate | affected users / eligible users | User-level prevalence |
| Affected-session rate | affected sessions / eligible sessions | Conversation-level prevalence |
| Release-specific rate | matches on release R / eligible sessions on release R | Whether one release concentrated the issue |
| Cohort-specific rate | matches in cohort C / eligible sessions in cohort C | Whether one segment is disproportionately affected |
Raw count alone can move in the wrong direction. If failures rise from 10 to 12 while eligible sessions double from 100 to 200, the occurrence rate falls from 10% to 6%. The team still has 12 cases to investigate, but the system improved on prevalence.
Every chart should show the time window, eligible denominator, detector, evaluator version, and sampling policy. If an LLM judge scored 20% of eligible sessions, label the rate as sampled and avoid presenting the raw matched count as the total number of failures.
Slice the rate by release, prompt version, model, provider, environment, tool, and cohort where instrumentation permits. Preserve missing-metadata rates too. A clean release comparison can hide that half the traffic lacked a release label.
How should you alert on escalation or regression?
An alert needs more than a threshold:
- metric and eligible population
- historical or seasonal baseline
- threshold or tolerance band
- measurement window
- minimum volume
- persistence requirement
- cooldown or keep-firing period
- owner and severity
- issue definition and investigation link
NIST’s control-chart guidance makes the tradeoff explicit: control limits encode a false-alarm decision. A universal three-sigma rule is unsafe for sparse failure counts or skewed rates. CUSUM can detect smaller sustained shifts, but it still requires choices about the baseline, false alarms, missed detections, and target shift.
For a simple operational setup, require the condition to remain true before firing and keep the alert active briefly after it clears. Prometheus exposes these ideas through for and keep_firing_for. The pattern reduces alert flapping, while the statistical threshold still needs to fit the data.
What lifecycle should a recurring issue keep?
Use a seven-step lifecycle:
- Capture. Record the complete trace hierarchy and relevant metadata.
- Define. Name the behavior, document the boundary, assign an owner, and choose a detector.
- Recognize. Apply exact, semantic, model-based, script, and human methods according to the failure.
- Measure. Track count, rate, affected users or sessions, and release or cohort slices.
- Alert. Compare against a baseline, require enough volume and persistence, and route the issue.
- Fix and preserve proof. Add representative failures to a versioned regression dataset and link the fix and test.
- Resolve and watch. Keep the issue’s definition and history. If the behavior returns, reopen it as regressed.
Latitude’s current Signal lifecycle includes New, Escalating, Ongoing, Resolved, Regressed, and Ignored. Current engineering behavior makes the distinction explicit: resolving archives the issue while evaluation continues; ignoring archives it as noise and stops evaluation. When a later evaluated occurrence qualifies against the same resolved Signal, it reopens as Regressed. That lifecycle preserves the difference between a fixed bug returning and an unrelated new issue.
What does a durable Signal look like in practice?
This redacted Latitude product example tracks a retail agent mishandling return eligibility. It demonstrates the Signal interface and lifecycle fields. It is not evidence of a customer production incident, and it did not cause the engineering PR that established resolved-to-regressed behavior.
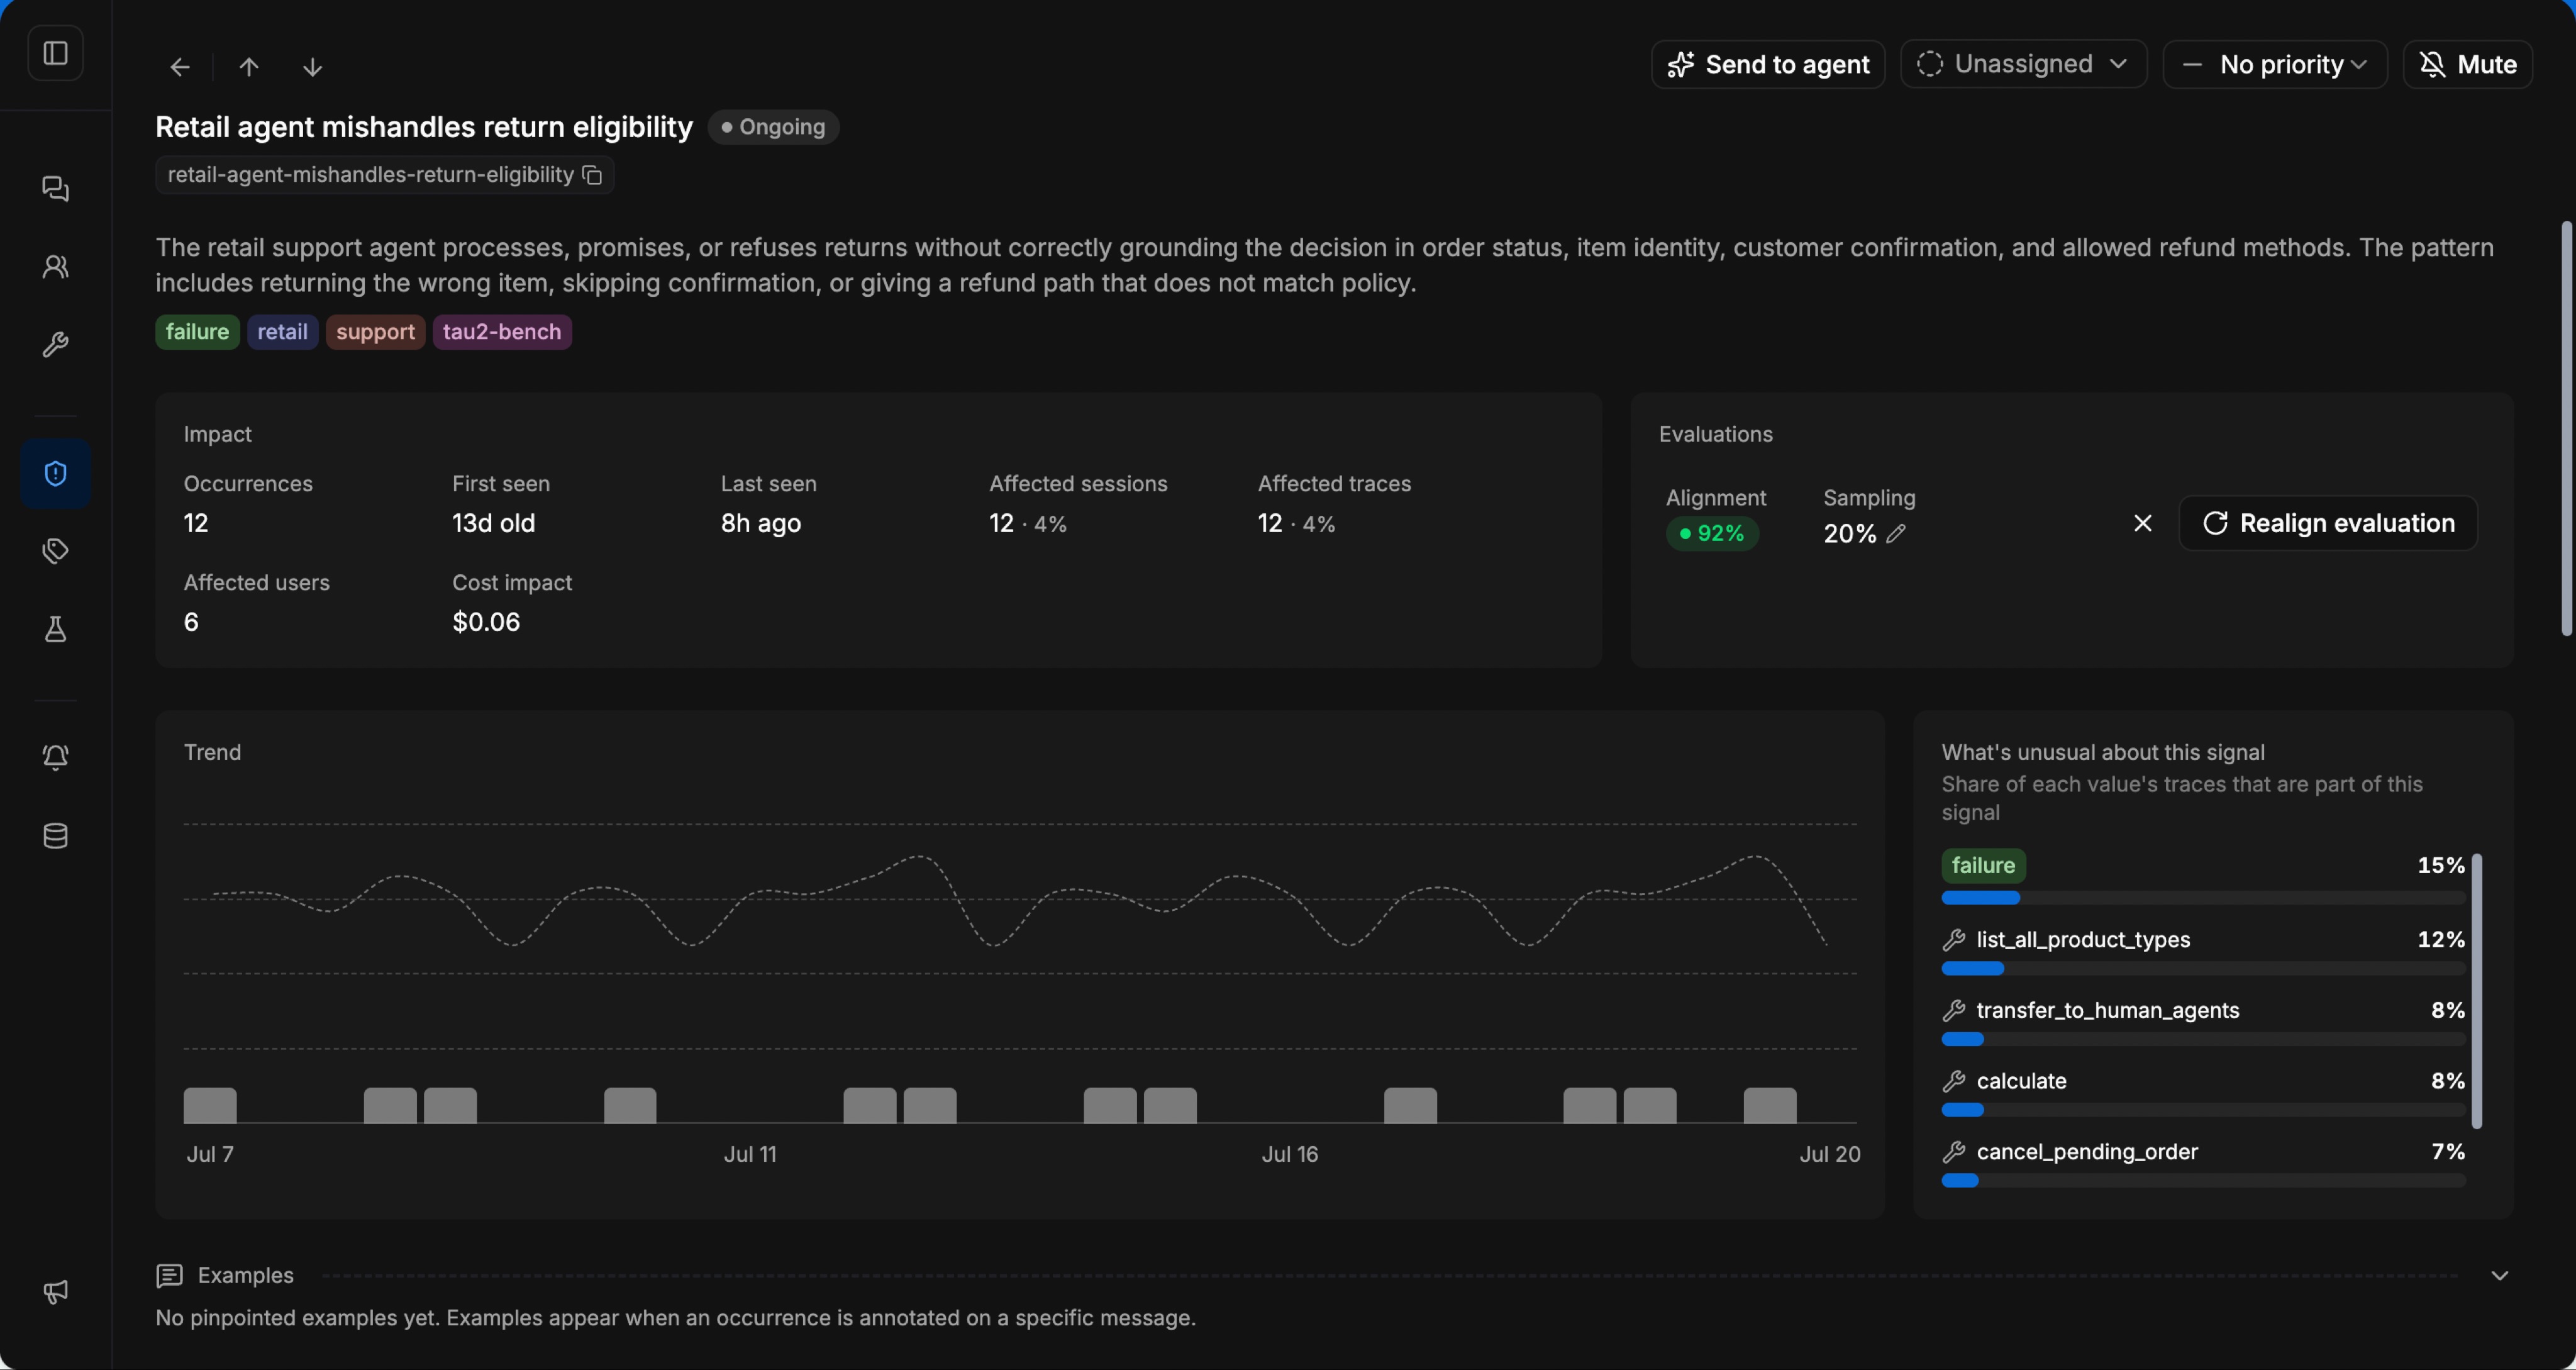
The Signal is Ongoing. It shows 12 occurrences, 12 affected sessions at 4%, 12 affected traces at 4%, and 6 affected users. It was first seen 13 days ago, last seen 8 hours ago, and shows $0.06 in cost impact. Those fields describe chronology and observed impact inside the displayed scope. They do not prove root cause or business loss.
The evaluator ran at 20% sampling. The UI does not establish that every eligible session was judged, so the 12 matches should be read within that sampling policy rather than as a full-traffic total. The displayed 92% alignment metric reports agreement on the reviewed set, but the screenshot does not expose its denominator, class balance, precision, recall, or error rates.
Occurrences, traces, and sessions are separate concepts even when this example shows the same count for each. Occurrences describe detector matches, traces preserve execution evidence, sessions provide the conversation-level denominator, and users describe blast radius.
A trace is occurrence evidence. A semantic cluster is a candidate family. An evaluator makes a membership decision. A Signal is the persistent lifecycle object. Behaviors help discover emerging usage or topic clusters, while a Signal tracks a known actionable failure with a detector and lifecycle. Neither clustering nor evaluation proves root cause.
How does the pattern become a regression test?
Promote selected production traces and boundary cases into a versioned dataset, replay them after relevant changes, and score them with the same quality criterion when the required inputs are available. Keep the production detector active after deployment, then compare the post-release rate with its baseline. The full implementation is covered in our guide to catching regressions after prompt or model updates. For structured failures, the tool-call error guide shows how exact evidence becomes repeatable coverage.
Through Agent Dispatch, Latitude can send a Signal’s context and sample traces to the team’s own coding agent. The coding agent investigates the codebase, implements the smallest correct fix, adds a regression test where appropriate, and can open a PR. Latitude supplies the trigger and context. A human reviews and merges the change.
A passing offline test shows that known cases work under the harness. A lower production rate supports real-world improvement. Together, those two forms of evidence keep a resolved issue covered.
FAQ
Is an error message enough to define a recurring LLM failure?
Only for structured failures with stable signatures. Semantic behaviors need a description, representative examples, and a calibrated detector because the wording varies.
Does semantic clustering identify root cause?
No. Clustering groups similar evidence and helps discover candidate patterns. Root cause requires inspecting traces, versions, tools, retrieval, and code paths.
Should I track affected users or affected sessions?
Use affected users when you have a stable, privacy-safe identity and care about human blast radius. Use affected sessions when identity is unavailable or one user can generate many conversations. Label the metric precisely.
How do I compare releases with different traffic volumes?
Compare release-specific rates using the number of eligible sessions on each release as the denominator. Keep the raw count beside the rate for investigation workload.
What happens when I change the evaluator?
Version it. Backfill historical data if the new rule can be applied consistently, or mark a break in the series. Avoid comparing rates produced by materially different definitions as if they were one metric.
How long should a resolved failure remain monitored?
As long as the behavior remains important and the surrounding system can change. Prompts, models, tools, traffic, and policies evolve, so a fixed issue can become relevant again months later.