
How do I find out how users actually use my AI agent?
You shipped an agent to do three things. Open the logs a month later and you find users are doing eleven, and the biggest one never appeared in a single spec.
This is the normal state, not a failure. A live agent produces thousands of turns a day, and the team hand-reads maybe a few dozen a week. You have all the transcripts and none of the picture. The question “how do people actually use this thing?” feels like it should be answerable from data you clearly own, and yet the honest answer for most teams is a shrug backed by a handful of anecdotes.
The reason it’s hard is that this is a discovery problem dressed up as a reporting problem. You can’t count what you haven’t named, and the whole point is that you don’t yet know what to name. This guide is a working method for reading the real distribution of usage off your transcripts, ordered from what you can do this afternoon to a pipeline that keeps telling you the truth as it drifts.
The short answer: summarize each session into the job the user brought, embed and cluster those summaries so usage groups itself by meaning, label the clusters, then attach outcome metrics to each. That reads the real distribution off your transcripts without anyone predefining a taxonomy.
Why the obvious approaches don’t answer the question
Two instincts show up first, and both quietly fail.
Reading transcripts by hand. It’s the right instinct and it doesn’t scale. A person reads a tiny, non-random sample, and worse, they only find what they already suspected. You come away with vivid anecdotes and no sense of the distribution, no idea whether the thing you noticed happens in 2% of sessions or 40%. Manual review gives you texture without proportion, and proportion is the whole question.
Bucketing with a predefined intent taxonomy. The classic move, inherited from the NLU era of Dialogflow and Rasa and Lex, is to enumerate a fixed set of intents up front and route each message into one. This was built for a closed world, and an open-ended LLM agent is not that world. It breaks in three ways:
- Infinite surface forms. Users phrase the same job a thousand ways, and the novel phrasings fall into a
no-matchbucket where real usage piles up unseen. - The real jobs are emergent. A fixed taxonomy can only measure the questions you already thought to ask. The most valuable finding is always the cluster nobody designed for, and a predefined scheme is structurally blind to it.
- The unit is wrong. Intent-per-message classifies the first thing a user typed. But a session is a multi-turn job with steps, and labeling it by its opening line mislabels it.
Both approaches share the same flaw: they impose your prior on the data. What you want is the opposite, to let the data tell you its own shape.
The technique: discover behaviors bottom-up
The method that actually works is unsupervised discovery. Instead of sorting sessions into buckets you defined, you let the sessions cluster themselves by meaning, then read off the groups that emerge. At a level a working engineer can build, the pipeline is five steps: summarize, embed, cluster, label, organize.
Summarize first. Don’t cluster raw transcripts. For each session, extract a short natural-language description of the job the user brought: “what task is the user asking the agent to do?” This one move (the key idea behind Anthropic’s Clio) denoises everything downstream. It normalizes wildly different transcript lengths, strips incidental wording, drops PII, and makes the clustering about the job rather than the vocabulary.
Embed. Turn each summary into a vector with a sentence-embedding model (Sentence-BERT and its descendants are the standard), so that semantic distance becomes geometric distance. This is the step that beats the infinite-surface-forms problem: “cancel my order” and “I need to call off a purchase I just made” land near each other even though they share almost no words.
Cluster. Group the vectors. Two families, with an honest tradeoff between them:
- k-means forces every session into a cluster and scales to millions. It’s what you want for a tidy, sized map of all your traffic. The cost: you pick the number of clusters up front, and it has no concept of junk, so outliers get absorbed into whatever cluster is nearest.
- HDBSCAN finds clusters of varying density, doesn’t need a cluster count, and explicitly labels noise. It’s what you want to surface tight, real themes and throw away the rest. The cost: a large “everything else” bucket, and sensitivity to its minimum-cluster-size setting.
Label. A cluster is just a set of session IDs until you name it. Feed a sample of each cluster’s members to an LLM and ask for a short title and description. The cheaper non-LLM fallback is class-based TF-IDF (the BERTopic approach): surface the terms that are frequent inside a cluster and rare outside it. Either way, always show the label next to real (redacted) member sessions, because labels over-generalize and you need to be able to check them.
Organize. Recursively cluster the labels into a hierarchy: a handful of top-level jobs, each fanning out into specifics. Now you have a tree you can navigate instead of a flat list of hundreds of groups.
The tradeoffs nobody tells you about
This pipeline works, and it will also lie to you in specific ways you should plan for.
- Granularity is a dial, not a truth. There’s no “correct” number of clusters. The standard metrics for choosing one (silhouette, elbow) are unstable on text embeddings and routinely disagree; scikit-learn’s own silhouette example shows how ambiguous the signal is. Treat cluster count as a product decision validated by usefulness, not an optimization with a right answer.
- Clusters drift. How people use your agent changes week to week, so a snapshot goes stale. Mature setups run two loops: periodically re-cluster from scratch to discover genuinely new jobs, and freeze the existing cluster centroids and assign new sessions to the nearest one, flagging the sessions that fit nothing as candidates for a new behavior.
- Noise is signal. The outlier bucket, the sessions that fit no clean cluster, is where new, rare, and abusive behavior lives. Clio caught coordinated misuse exactly there. Don’t delete it; watch it.
- Clusters can be artifacts. A “cluster” can turn out to be a length effect, boilerplate, one power user, or one language. Validate by checking reproducibility on a fresh slice of data, reading a random sample of members, and confirming a cluster spans many users rather than one.
The ladder: ship this afternoon, mature over a quarter
You do not need the full pipeline to start learning today. Climb this ladder as far as the decision justifies.
- Skim a stratified sample by hand (an afternoon). Pull 50 to 100 sessions, but stratify: some short, some long, some that ended well, some that abandoned. Read them and jot categories. This buys you real intuition and your first candidate labels. Its limit is exactly what you’d expect: tiny, prior-driven, and no sizing.
- Keyword and regex tagging (an hour). Now that you can name a few jobs, grep for them to get rough volumes. This is a coverage floor, not the answer: it only finds the phrasings you predicted.
- LLM-label a sample into topics (a day, a modest bill). Take a few thousand sessions, have an LLM write a one-line job summary for each, then cluster or induce 15 to 30 categories from those. This is the highest value-per-effort rung, and it’s where most teams should live before building any infrastructure.
- Full embedding-and-clustering pipeline, running continuously. The five-step method above on a schedule, with new-session assignment, drift monitoring, and outcome metrics per cluster. This is real, ongoing engineering. It’s also the compounding asset. Don’t sell it to a team that hasn’t done step 1.
The point of the ladder is that steps 1 through 3 are not throwaways. They’re how you learn enough to know whether step 4 is worth it, and they de-risk it by giving you a rough map to check the automated one against.
Naming the job is half of it. Outcomes are the other half.
Knowing that “Order Management” is your biggest post-purchase job at 182 sessions is interesting. Knowing which of those sessions abandoned or escalated tells you whether that volume is a win or a backlog. Size alone ranks attention; size plus outcomes ranks work.
The move that turns a usage map into a work list is measuring outcomes within each cluster: resolution rate, abandonment, escalation to a human, hesitation and repair loops, and satisfaction. Before you have a tool for it, you compute these the same way you got the labels: an LLM reads each session and tags whether it resolved, abandoned, or escalated, and you aggregate those tags per cluster. Once every behavior carries its own outcome profile, prioritization stops being a debate. Impact is size times badness. The biggest cluster with the worst outcomes is where you spend the week, and you can point at the number that says so.
This is also where the “you’ll be surprised by your own data” effect is strongest. Real usage is far more skewed than teams assume. OpenAI’s How People Use ChatGPT study found roughly 80% of usage concentrated in just three categories. You are almost certainly under-weighting your biggest jobs and over-investing in a long tail that barely gets used, and you can’t see it until the clusters are sized.
What this looks like when it’s built for you
Here’s the same method as a running system instead of a notebook. In Latitude, the clusters are called Behaviors: the platform reads your agent’s sessions, groups them by the job the user actually brought, and names each group automatically. You don’t define them up front, which is the whole point.
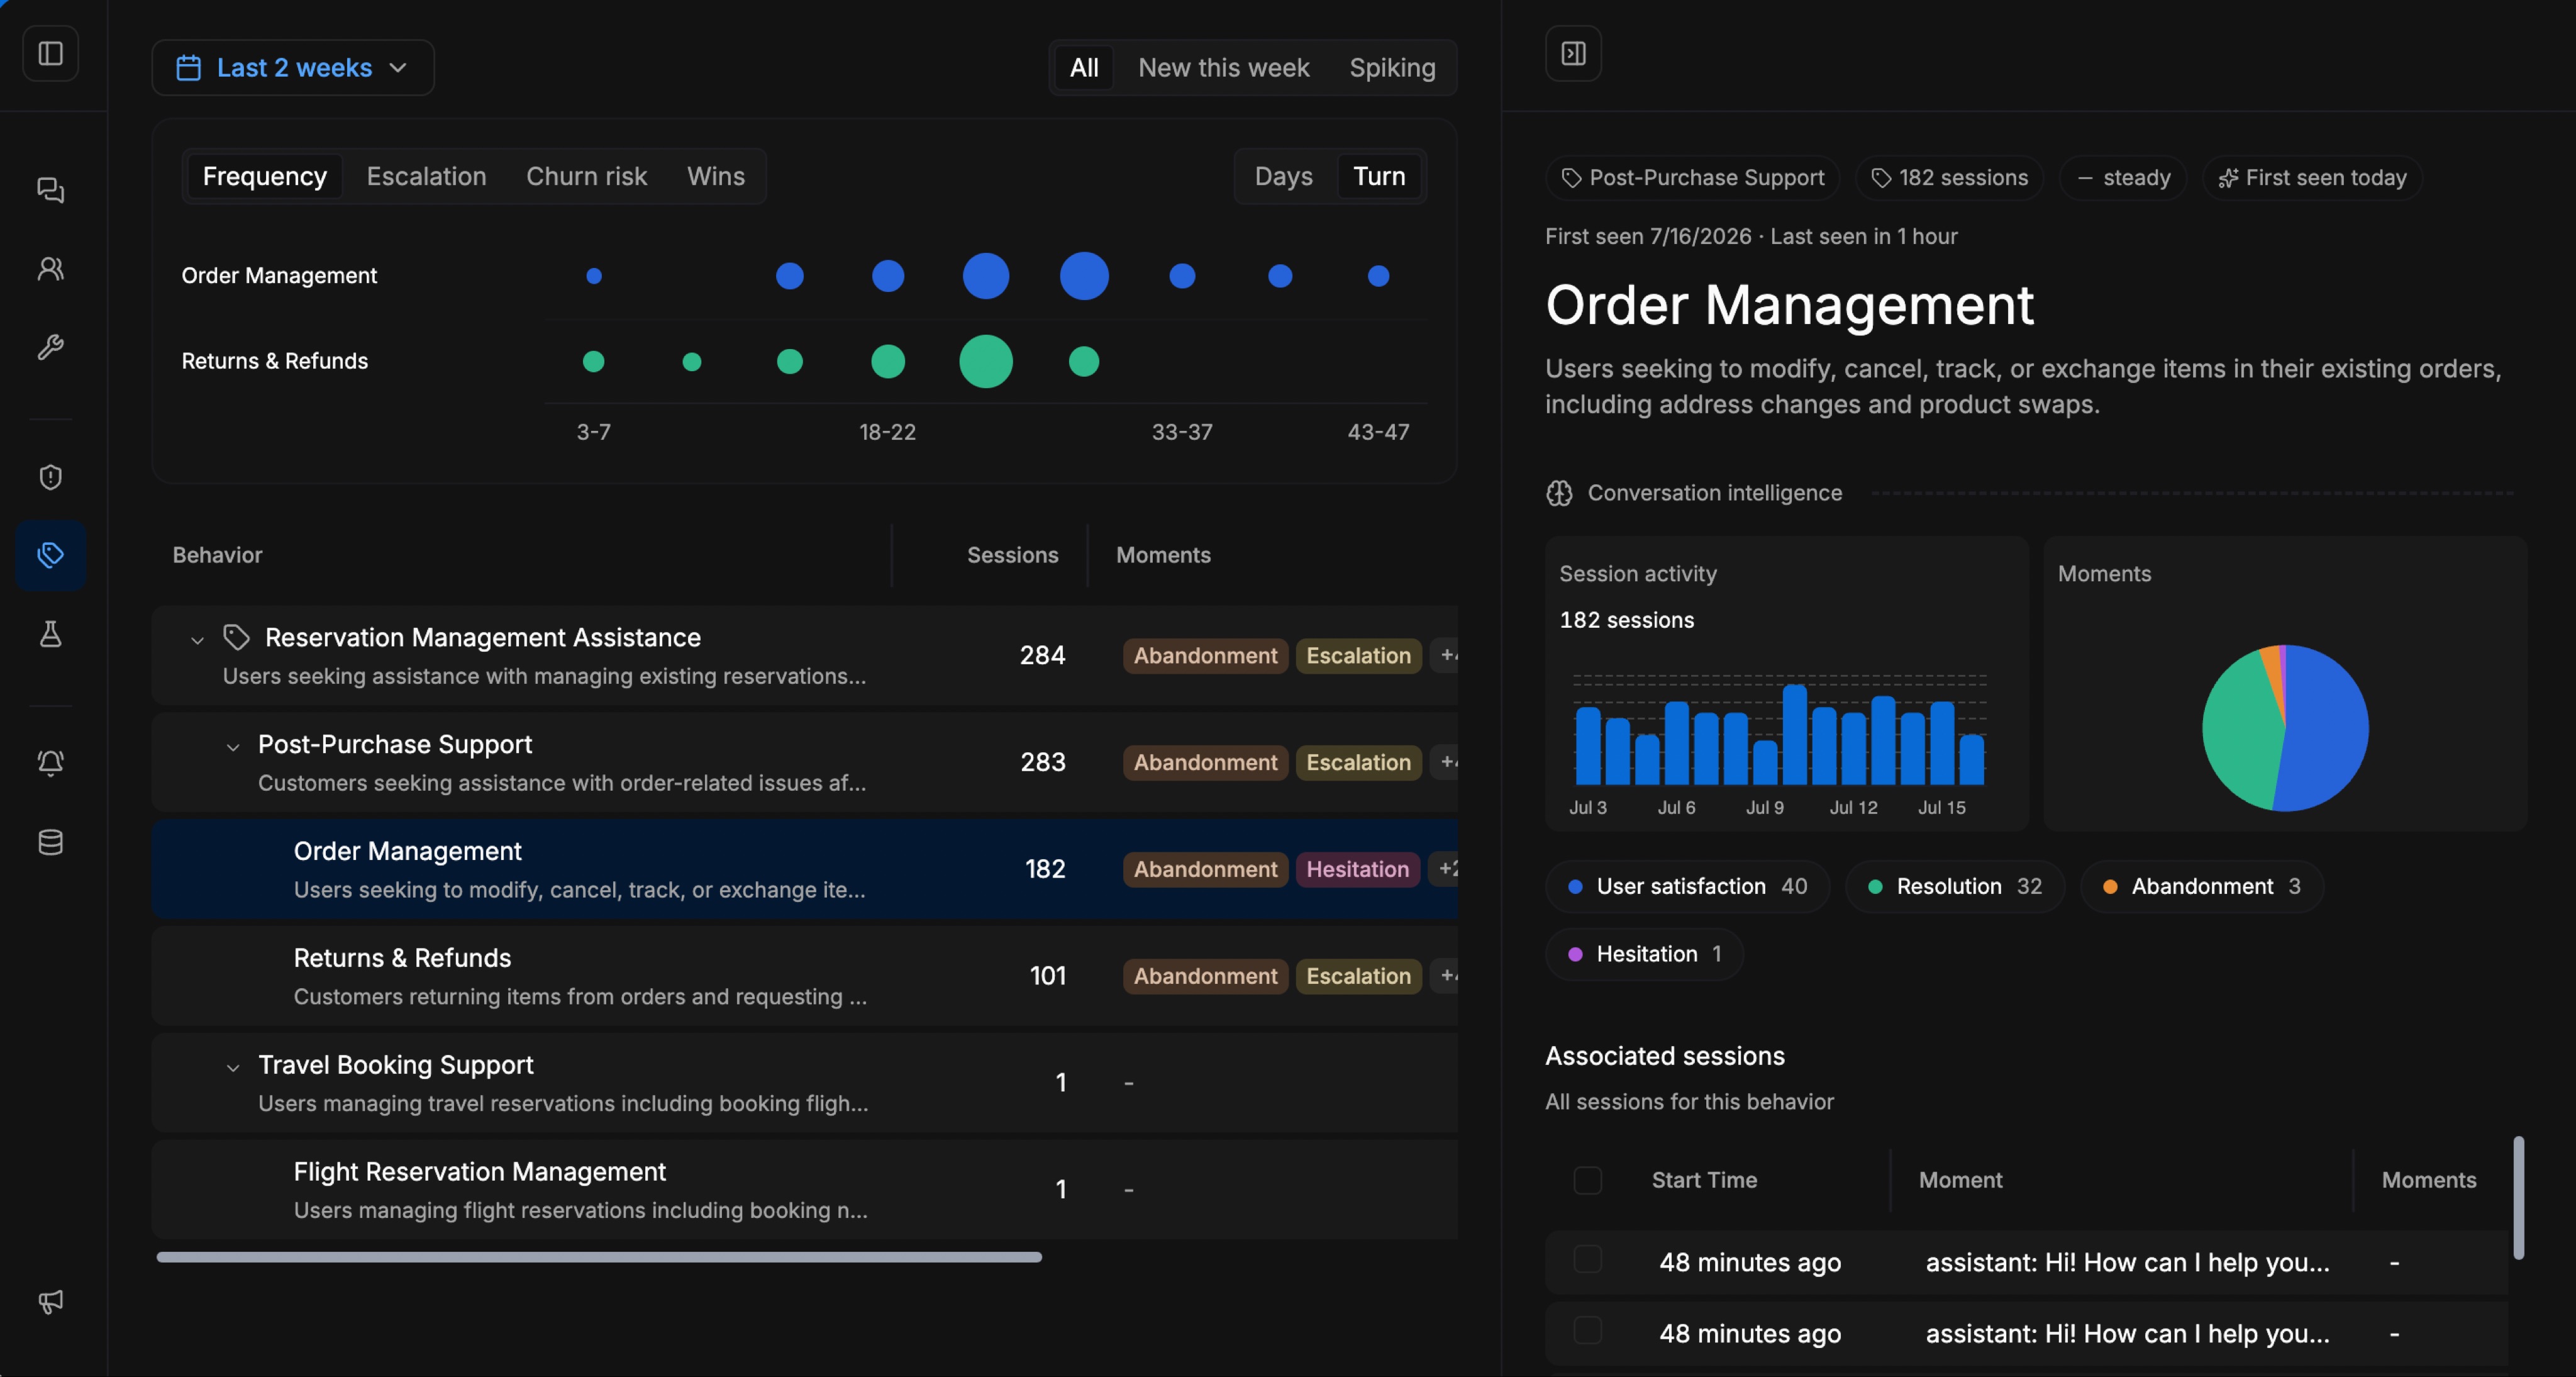
Reading it left to right is reading the method run to completion. The left column is the sized, labeled hierarchy: Post-Purchase Support (283 sessions) fans out into Order Management (182) and Returns & Refunds (101), and sits alongside a separate Reservation Management job (284). Nobody wrote those categories; they emerged from the transcripts. Each carries a trend state (Order Management is marked steady, first seen today), which is the drift-tracking loop made visible: a behavior that suddenly reads spiking is the highest-value alert you can get, because it’s an emergent job, a viral use, or an incident.
The detail panel on the right is the outcomes half. Its plain-language description (“users seeking to modify, cancel, track, or exchange items in their existing orders”) is the auto-generated cluster label. Below it, the Moments breakdown scores what happened inside those 182 sessions: 40 user-satisfaction, 32 resolution, 3 abandonment, 1 hesitation. These are tagged events within sessions, not one label per session, so they won’t sum to the session count; a single session can raise several moments or none. That’s the size-times-badness read available at a glance. A big cluster full of abandonment and escalation is where the work is, and you’re looking at the evidence rather than arguing about it.
The engineering value is that the whole pipeline (summarize, embed, cluster, label, organize, then attach outcomes) runs continuously instead of being a quarterly analysis you commission and then let rot. The same session data also feeds the failure detectors that catch tool-call errors and user frustration inside those behaviors, so “what are people doing” and “where is it going wrong” read off the same map.
A minimal setup you can actually run
Putting it together, the smallest thing that teaches you something real:
- Skim a stratified sample by hand to get your first honest categories and kill the illusion that you already know.
- LLM-summarize each session into a one-line job, because you should cluster the job, not the raw words.
- Cluster the summaries and label the groups, k-means for a full sized map or HDBSCAN to surface tight themes and isolate noise.
- Size every cluster and attach outcomes (resolution, abandonment, escalation), so prioritization becomes impact = size times badness instead of a debate.
- Re-run it on a schedule and watch for new and spiking clusters, because the emergent job you didn’t design for is the finding that pays for the whole exercise.
Steps 1 through 3 tell you what users do. Steps 4 and 5 tell you what to do about it. The one teams skip is step 4, and it’s why so many usage dashboards get admired once and never opened again. A map without outcomes attached is a picture you look at; a map with them is a queue you work.
FAQ
Why can’t I just use a predefined list of intents?
Because a fixed taxonomy only measures the questions you already thought to ask, and the whole value here is discovering the jobs you didn’t design for. Predefined intents also choke on the infinite ways users phrase the same request, dumping novel phrasings into a no-match bucket where real usage hides. Discover the categories bottom-up from the transcripts, then you can track them.
What’s the actual pipeline for clustering conversations? Summarize each session into a one-line description of the user’s job, embed those summaries with a sentence-embedding model so semantic distance becomes geometric distance, cluster the vectors (k-means for full coverage, HDBSCAN for tight themes plus explicit noise), label each cluster with an LLM, and organize the labels into a hierarchy. Then attach outcome metrics per cluster.
How many clusters should I have? There’s no correct number. The usual metrics for picking one are unstable on text embeddings and often disagree, so treat cluster count as a product decision: pick the granularity that’s useful to act on and validate it by reading real member sessions. Too few and distinct jobs blur together; too many and you drown in near-duplicates.
Do I need embeddings and clustering to start? No. Start by hand-skimming a stratified sample of 50 to 100 sessions this afternoon, then LLM-label a few thousand into rough topics. Most teams learn most of what they need at those rungs. Build the full continuous pipeline only once the decisions it informs justify the engineering.
How do I turn usage clusters into decisions? Size each cluster and attach outcomes: resolution rate, abandonment, escalation, hesitation, satisfaction. Prioritization then becomes impact = size times badness, so the biggest cluster with the worst outcomes is where you work first. Watching for new or spiking clusters over time surfaces emergent jobs and incidents before they show up as churn.
What about behavior that doesn’t fit any cluster? Don’t throw it away. The outlier or noise bucket is where rare, new, and abusive usage lives, and it’s often the most valuable thing to watch. A session that fits no existing behavior is a candidate for a new one, which is exactly how you catch a shift in how people use your agent as it happens.