
How to detect tool-call errors in an agentic workflow
Your agent works in the demo. Then it ships, and somewhere in a thousand sessions it calls get_order_details with a customer’s name where an order ID should go, gets an error back, apologizes, and quietly hands the user a wrong answer. Nobody files a bug. The token count looks normal. Your uptime dashboard is green. The failure is real and completely invisible.
Tool calls are where agents touch the real world, and they are where agents break most. The model has to pick the right function, fill in arguments that satisfy a schema, and then actually use what comes back. Any of those three can go wrong, and most monitoring setups watch none of them. It shows up in the benchmarks too: on τ-bench, which scores agents on real tool-use tasks, even a strong model’s pass^8 (getting the same task right on all eight independent tries) falls below 25%. Single-attempt accuracy is not production reliability.
This guide is a working method for catching tool-call failures you’d otherwise miss, ordered from what you can ship this afternoon to what actually holds up at scale.
First, know what “tool-call error” actually covers
The phrase hides at least three different failures that need three different detectors. Separate them before you build anything.
- The model messed up the call. Wrong tool, missing tool, a call it shouldn’t have made, or arguments that don’t fit the schema (wrong types, hallucinated fields, an order ID that doesn’t exist). The tool never even ran correctly, or ran on garbage.
- The tool itself failed. The call was well-formed, but the API returned a 4xx/5xx, timed out, hit a rate limit, or raised a business-rule error (“non-delivered order cannot be exchanged”). Your code is fine; the world said no.
- The model mishandled the result. The tool returned a clean error or an empty result, and the model ignored it, retried the same broken call in a loop, or told the user “done” anyway. This is the hardest one to see and the most damaging.
Most teams instrument the middle bucket, because those are ordinary exceptions their backend already logs. The first and third buckets are where agents actually go wrong, and they need detection built for agents rather than microservices.
A taxonomy you can actually detect against
Here is the fuller failure map, with what each one looks like and how you’d catch it programmatically. Cheap, deterministic checks first.
| Failure mode | What it looks like | How to detect it |
|---|---|---|
| Malformed arguments | Wrong type, missing required field, hallucinated param | Validate the call against the tool’s JSON schema before executing |
| Invalid argument value | Well-typed but nonexistent (order ID, SKU, email) | Tool returns a “not found” error; catch and classify it |
| Wrong tool chosen | Model reaches for the wrong function for the intent | Compare tool choice to expected tool for the task; watch error rate per tool |
| Missing tool call | Model answers from memory when it should have called a tool | Rule: certain intents must be preceded by a tool span |
| Tool execution error | API 4xx/5xx, timeout, rate limit | Status/exit code on the tool span; latency threshold |
| Unparseable output | Tool returns non-JSON or malformed payload | Parse-check the result; fail closed |
| Ignored result | Tool errored or returned empty, model proceeded anyway | LLM-as-judge over the turn: did the response use the tool output? |
| Loop / thrashing | Same call repeated with no progress | Counter on identical (tool, args) within a session |
| Bad sequencing | Dependent call fired before its prerequisite | Rule over ordered spans (e.g. exchange before delivery confirmed) |
| JSON parse error in the call | The function-call payload itself won’t parse | Catch at the framework boundary before execution |
The top rows are pure code. The bottom rows need either session-level state or a semantic judge. You want both layers, and you want to know which failure you’re looking at, because “the agent errored” is not an actionable bug report.
Detection, cheapest to most sophisticated
1. Deterministic checks (ship today)
The cheapest wins are rules, and they catch a surprising share of failures.
- Schema validation. Every tool already has a JSON schema (that’s how the model knows how to call it). Validate the arguments against it before you execute. Wrong types, missing required fields, and most hallucinated params die right here for zero marginal cost.
- Status and latency. Treat every tool call like an HTTP call: record its status and its duration. Non-2xx is an error; a p95 that spikes is a degradation. This is table stakes and most people still skip it.
- Loop counters. Keep a small map of
(tool_name, arguments)seen this session. The same call twice with no new information is a thrashing signal. Cap it and break.
These are cheap, have near-zero false positives, and give you real coverage on the “model messed up the call” and “tool failed” buckets. They cannot catch the model ignoring a result, because that failure lives in the model’s reasoning, where no status code reaches.
2. Telemetry and tracing signals (the layer that scales)
To detect across sessions instead of one call at a time, you need your tool calls in traces. The emerging standard here is the OpenTelemetry GenAI semantic conventions, which define how to represent model and tool operations as spans. The relevant pieces:
- A tool invocation is its own span (span kind
execute_tool), child of the model span that requested it. gen_ai.tool.namecarries the function name,gen_ai.tool.call.idties the request to its result, andgen_ai.operation.namemarks it as a tool operation.- A failed call sets the span status to
ERRORand records an exception event witherror.type.
Once tool calls are spans with those attributes, detection becomes querying: error rate per gen_ai.tool.name, p95 latency per tool, count of ERROR-status tool spans per session. You stop reading individual transcripts and start ranking your tools by how often they fail. This is also where the OTel convention pays off: any backend that speaks it can compute these without custom parsing.
3. LLM-as-judge (for the failures code can’t see)
The “model ignored the tool result” failure has no status code. The call succeeded, the payload was valid, and the model still did the wrong thing with it. The only reliable detector is another model reading the turn.
Feed a judge the tool call, its result, and the model’s next message, and ask a narrow question: did the response correctly use the tool output? A judge catches the retry-in-a-loop, the “I’ve completed that” after an error, the answer that contradicts the data it just fetched. The tradeoffs are the usual ones: real cost and latency (it works as a batch/retrospective tool rather than a per-call gate), and it needs a tight rubric or it drifts. Sample it; you don’t need to judge every call to spot a pattern.
The rule of thumb: deterministic checks for volume and speed, tracing for cross-session patterns, a judge for the semantic failures that hide from both.
What the data looks like when you can see it
Here’s the shift in practice. Instead of grepping transcripts, you rank an agent’s tools by how often they fail. This is a tools view from an internal Latitude demo (a retail support agent), scoped to the last month:
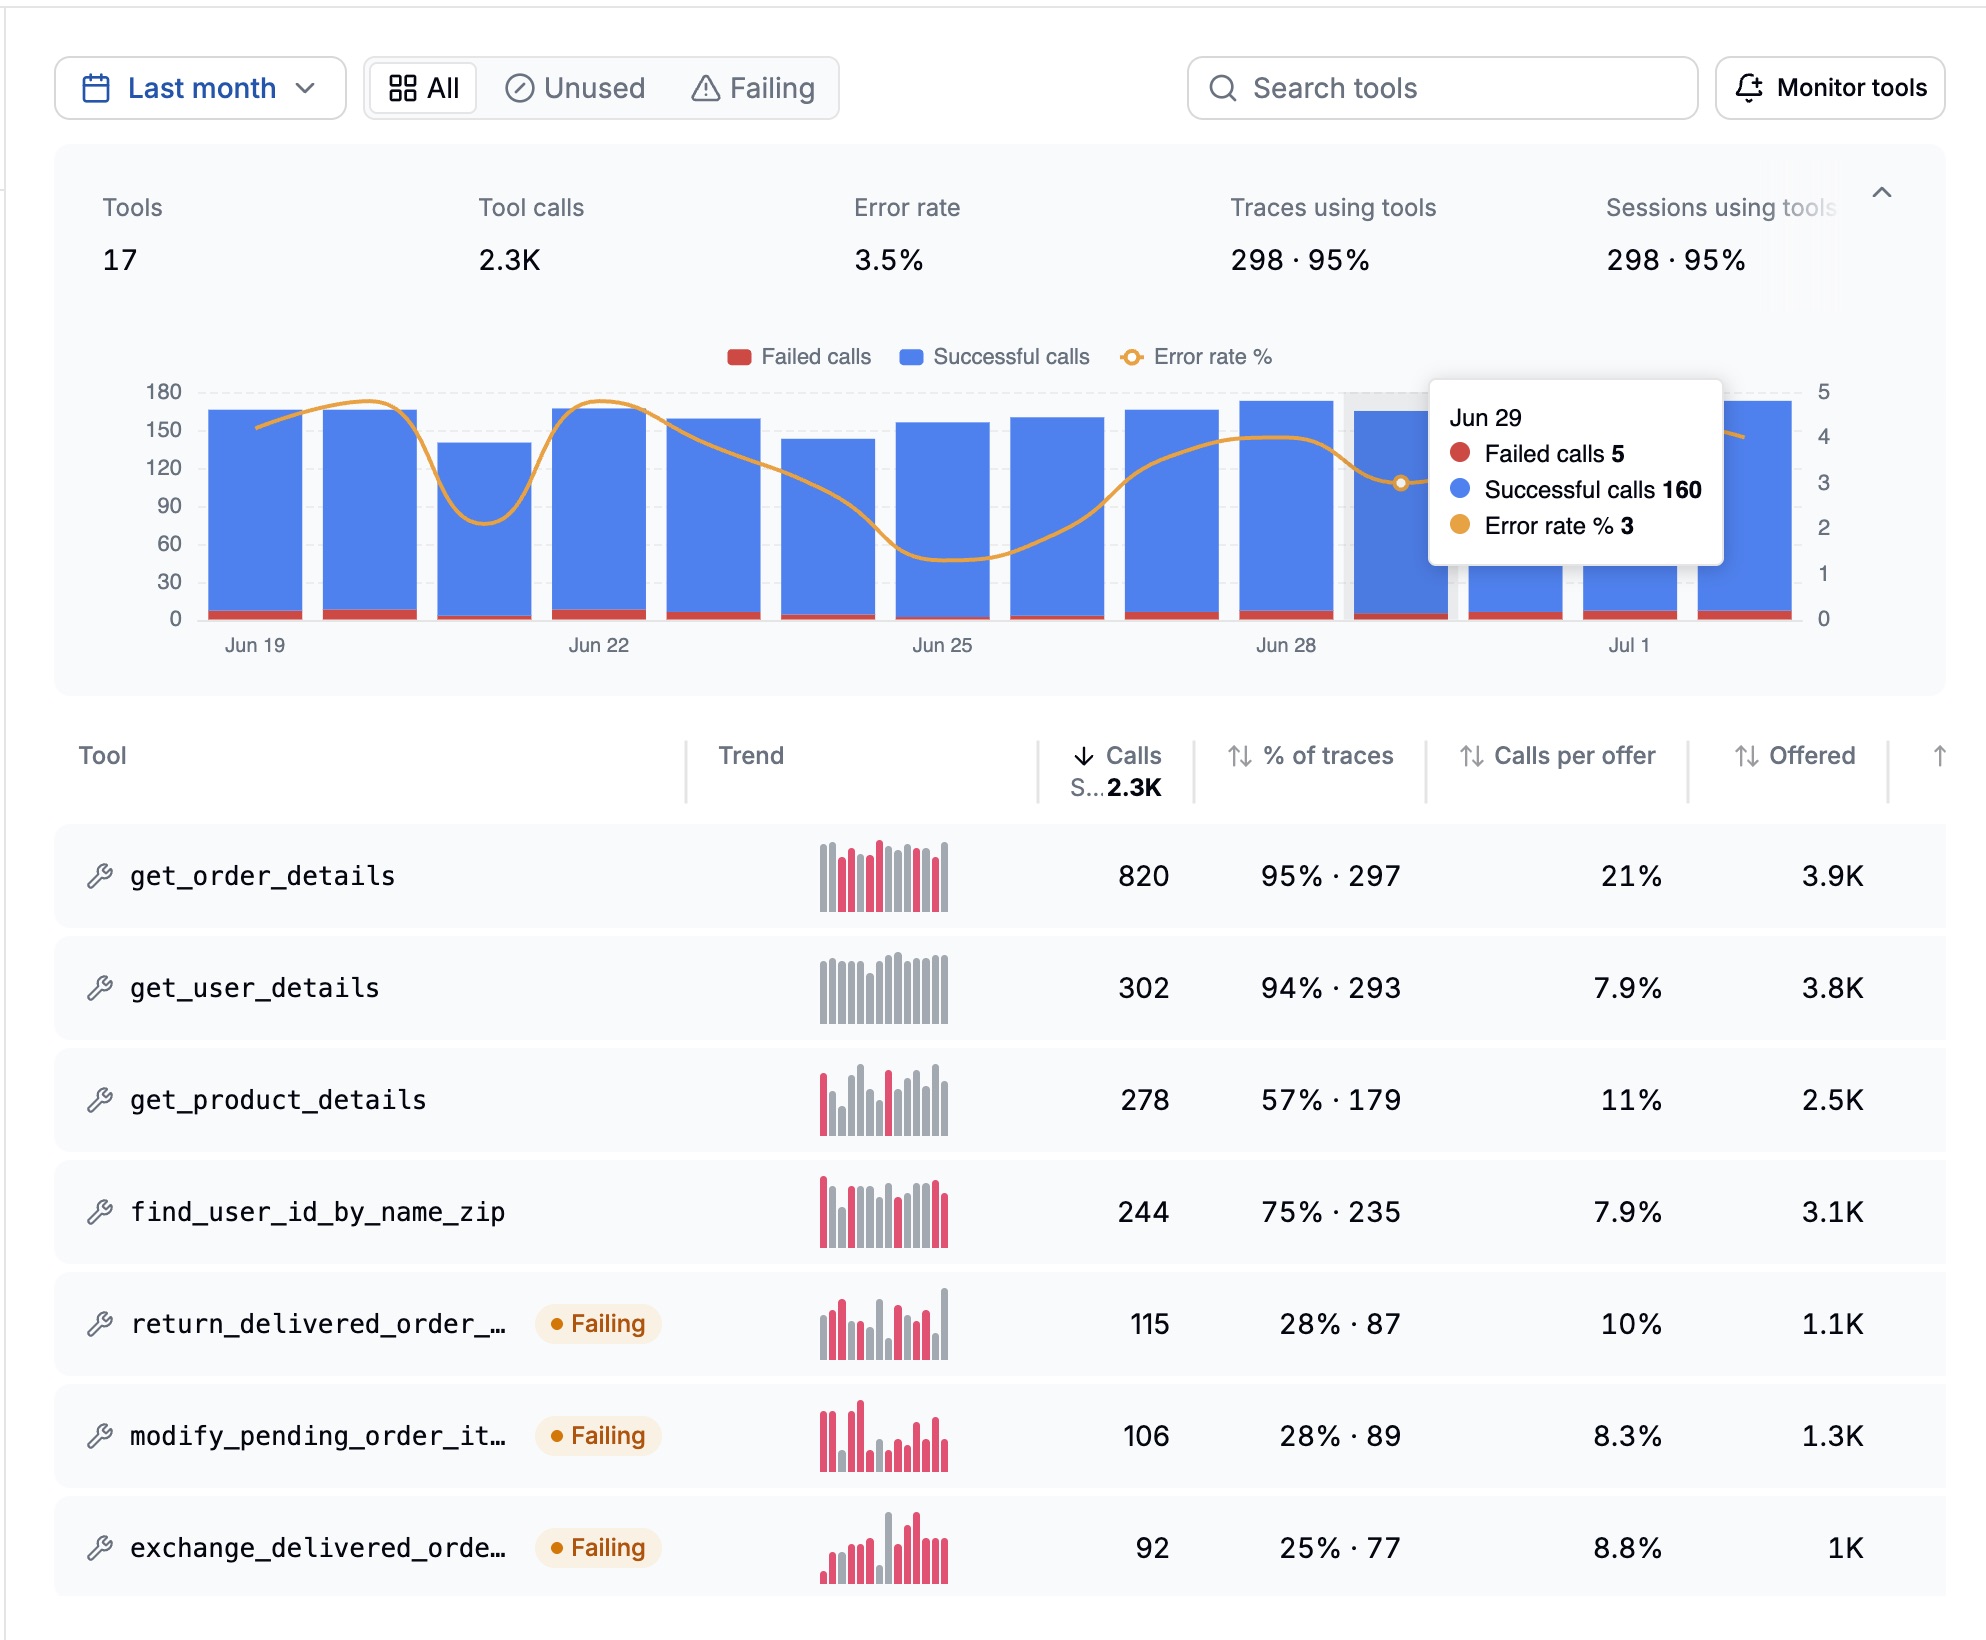
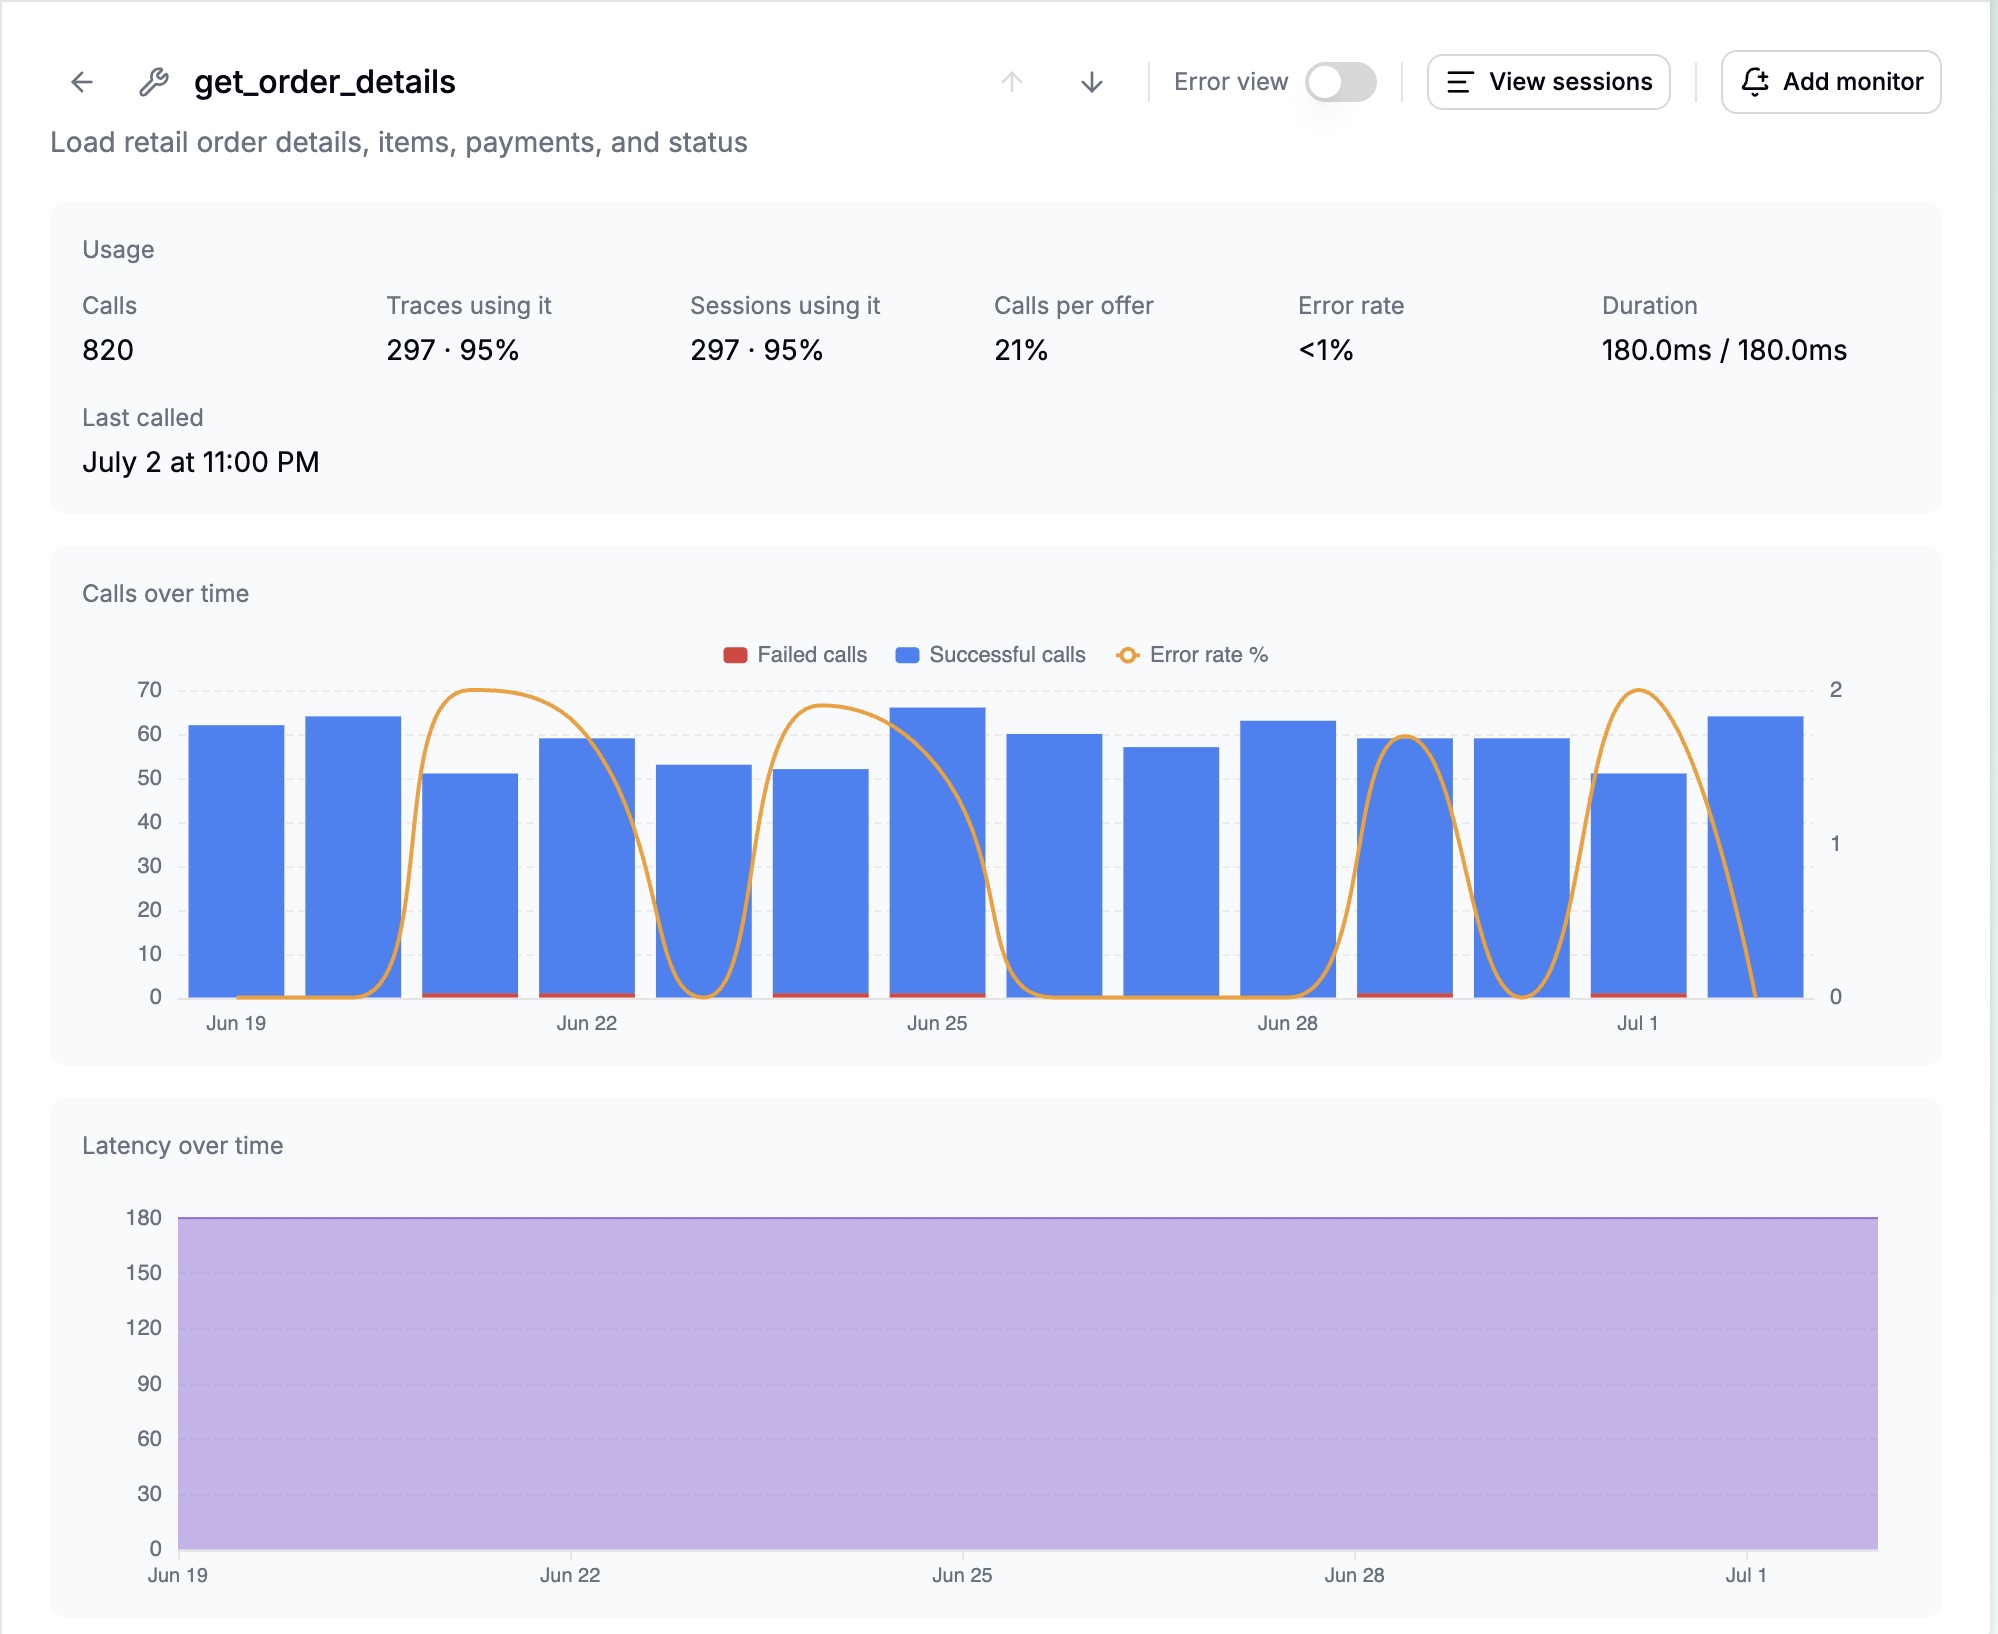
Two things jump out immediately, and neither is visible in a per-call log. First, the read tools (get_order_details, get_user_details) run clean, while the write tools (return_delivered_order_items, modify_pending_order_items, exchange_delivered_order_items) carry a Failing badge. Second, a healthy tool and a broken one look identical until you put error rate next to volume. get_order_details is the highest-volume tool here and sits at a 2.5% error rate; here is a single tool on its own, calls and latency charted over time, so you can see what a stable baseline looks like:
The sharpest finding in this data has nothing to do with a broken tool. It’s a wrongly-chosen one. The agent has two ways to resolve a customer: find_user_id_by_email and find_user_id_by_name_zip. Same job. But email lookup fails 23.1% of the time (57 of 247 calls), and every single failure is the same message, “User not found.” Its sibling, name-plus-zip, fails 5.5%. A 4x reliability gap on the same intent, because the model keeps reaching for email lookup when it doesn’t have a valid email. You only ever see that by ranking tools by error rate side by side. A blended number would bury it.
Reading the failures: usually the model, rarely the tool
Drill into a failing tool and group its errors, and the taxonomy from the top of this guide shows up in real data. For exchange_delivered_order_items, the failures cluster like this:
- 21 × “Non-delivered order cannot be exchanged”. A sequencing error: the agent tried to exchange an order before confirming it was delivered.
- 5 × “New item not found or available”. A bad-argument error: the agent passed an item ID that doesn’t exist.
- 4 × “Insufficient gift card balance” and 4 × “Payment method not found”. Business-rule and argument failures.
Same pattern on its sibling tools. modify_pending_order_items fails 21 times on “the number of items to be exchanged should match” and 10 times on “the new item id should be different from the old item id,” both pure argument mistakes the model makes on a perfectly healthy tool.
Look at what these have in common: almost none of them are the tool being down. They’re the model calling a healthy tool with the wrong arguments or in the wrong order. If you only monitored API health, every one of these would read as green. The tool did exactly what it was told; it was told the wrong thing.
This is why argument-level inspection matters. Grouping the actual parameter values a tool was called with turns a vague “it’s failing” into a specific “it’s being called out of order” or “it’s passed a bad ID.” Here’s the argument breakdown and co-occurrence view for one tool, cancel_pending_order, showing the reasons it’s called with and which tools it fires alongside:
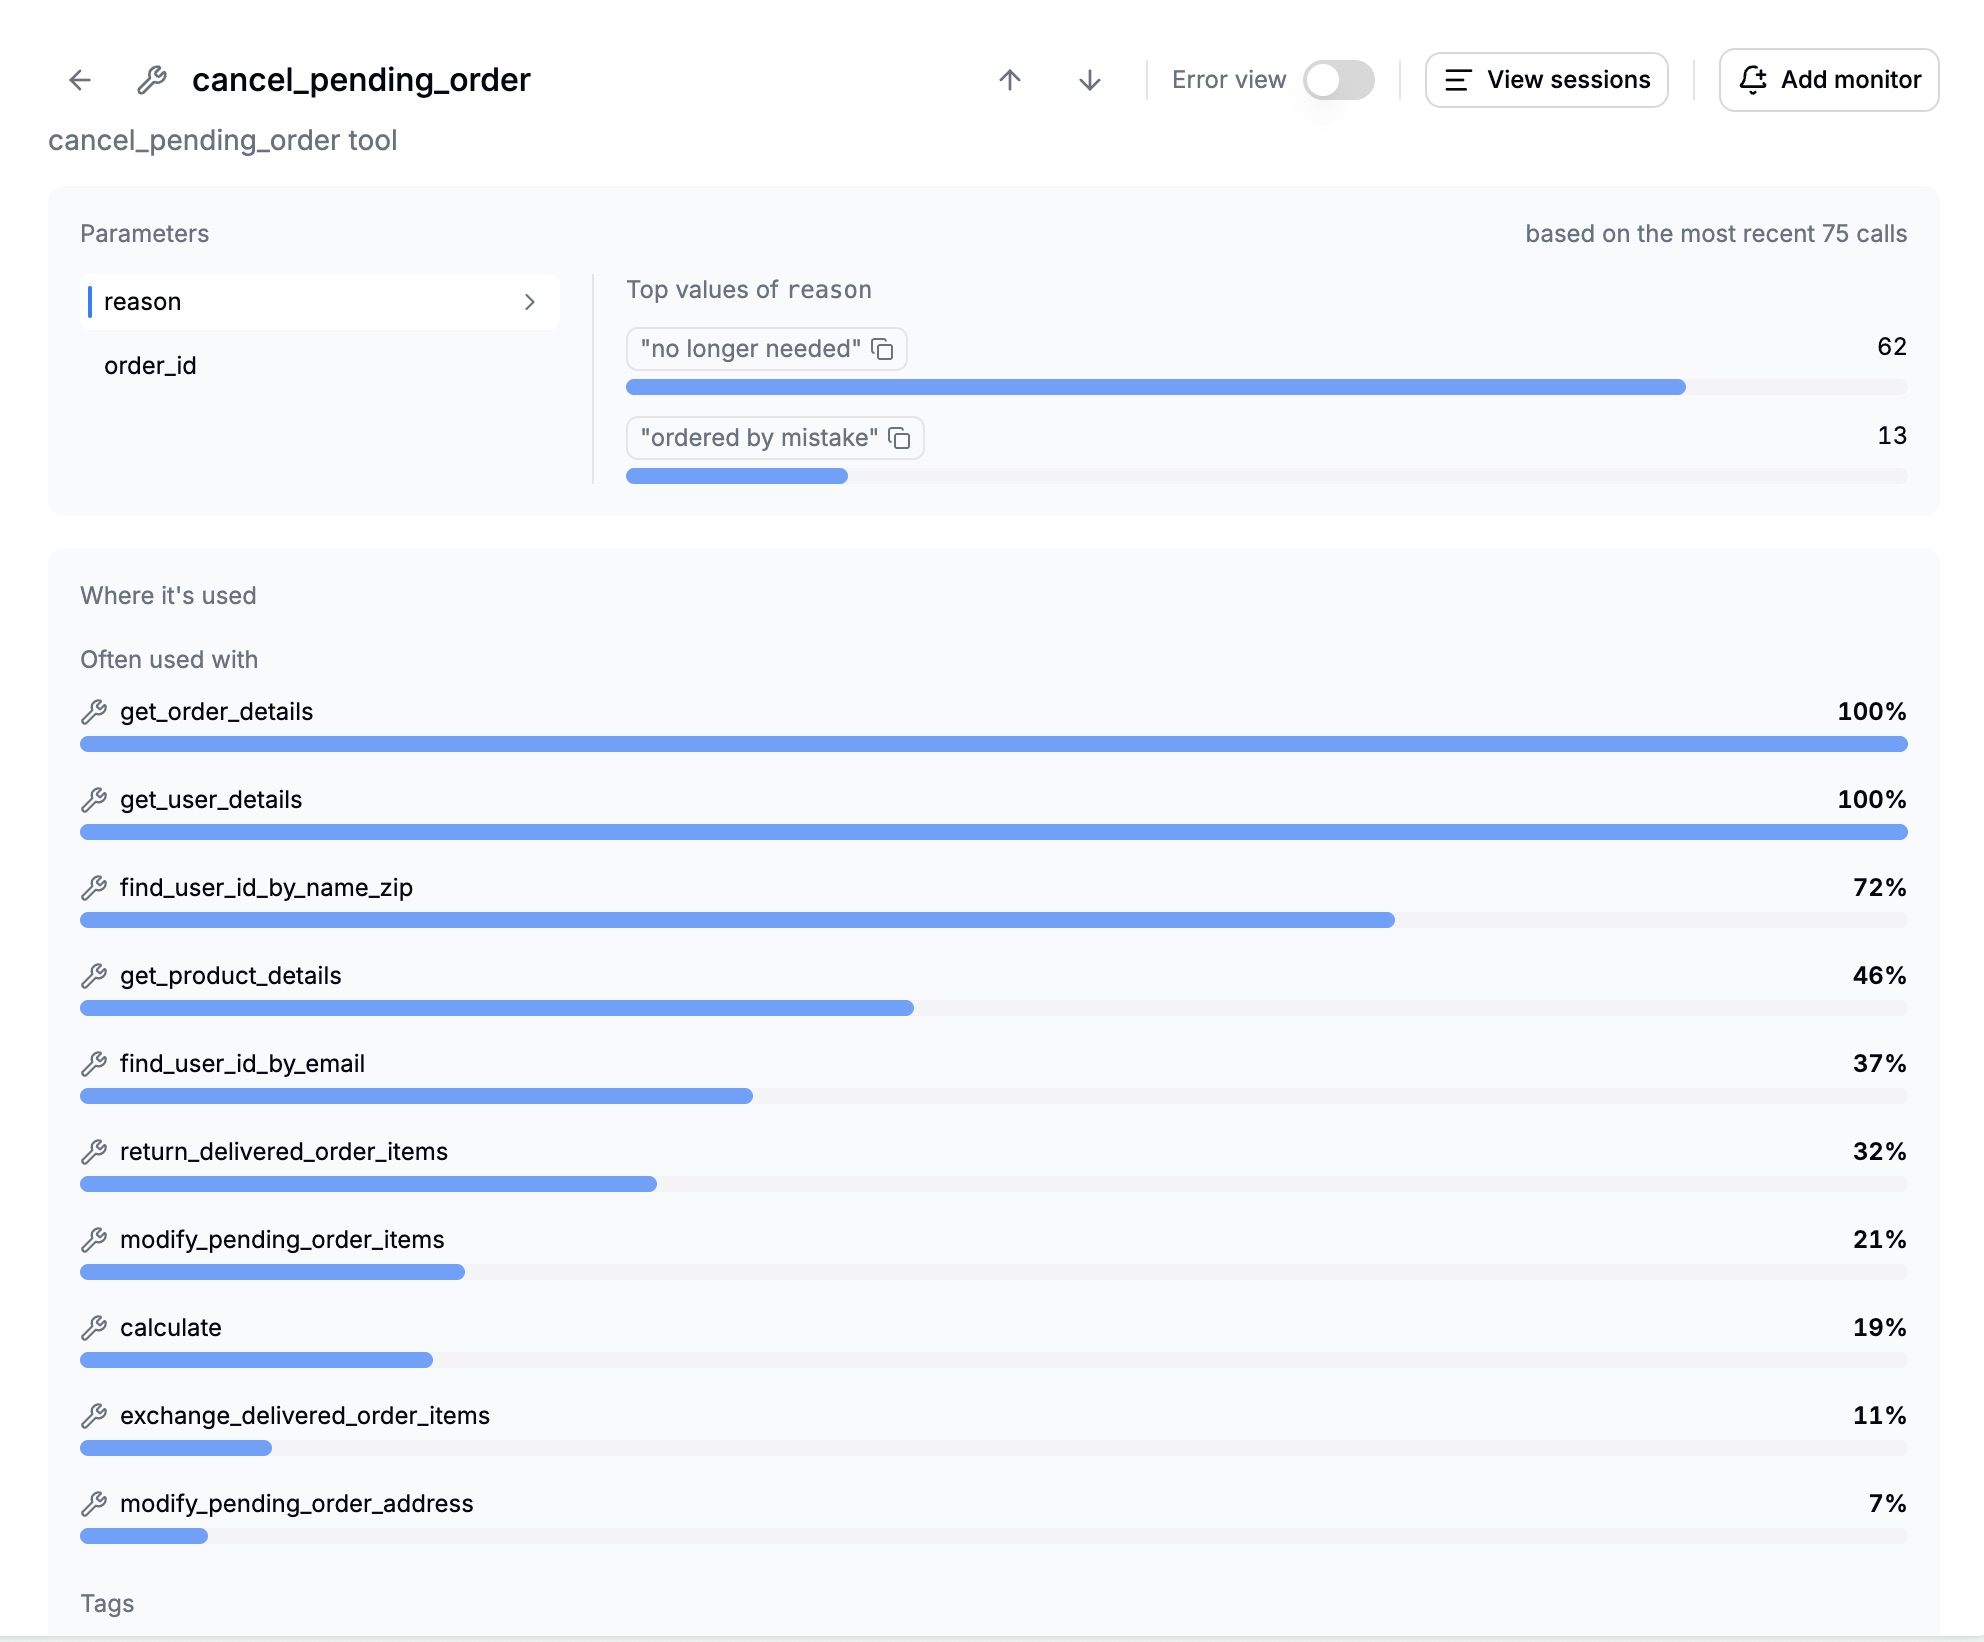
The co-occurrence panel is the sequencing lens: it shows which tools a given call reliably runs alongside, which tells you the expected order of operations. When a failing tool skips its usual predecessor, you’ve found your sequencing bug without reading a single transcript.
A minimal setup that covers all three buckets
Putting it together, the smallest thing that actually works:
- Validate arguments against each tool’s JSON schema before executing. Catches malformed and most hallucinated calls for free.
- Emit every tool call as a span with the OTel GenAI attributes (
gen_ai.tool.name,gen_ai.tool.call.id, error status on failure). This is what makes cross-session detection possible. - Alert on per-tool error rate and latency, beyond overall uptime. A 3.5% blended rate can hide a write tool failing 30% of the time.
- Group failures by error message and by argument values so “it’s failing” becomes “it’s called out of order” or “it’s passed a bad ID.”
- Sample an LLM-as-judge over turns where a tool errored, to catch the model proceeding anyway.
Steps 1 to 4 are deterministic and cheap. Step 5 is the only one that costs model calls, and you sample it. That’s the whole coverage.
The one step most teams get wrong is step 4. Once tool calls are OTel spans, grouping their failures is harder than it sounds, because raw error messages don’t group cleanly: “New item 3788616824 not found” and “New item 3111466194 not found” are the same bug with a different ID, and a naive GROUP BY message splits them into two clusters of one. You have to normalize the variable fragments (IDs, timestamps, quantities) before you count, or the one failure that matters gets scattered into noise. That normalization step is what turns a wall of error strings into the ranked clusters shown above. Latitude does this normalization for you, but the mechanism is the point whether you build it or buy it: strip the variables, then cluster, then rank.
FAQ
What’s the difference between a tool error and an agent error? A tool error is the tool failing (API down, timeout, business-rule rejection). An agent error is the model misusing a healthy tool: wrong tool, bad arguments, wrong sequence, or ignoring the result. Most production “tool failures” are actually agent errors, which is why monitoring API health alone misses them.
How do I detect when the model ignores a tool’s result? There’s no status code for it, because the call succeeded. Use an LLM-as-judge: give it the tool result and the model’s next message and ask whether the response correctly used the output. Sample it rather than running it on every call.
What OpenTelemetry attributes should I record for tool calls?
At minimum gen_ai.tool.name, gen_ai.tool.call.id (to tie request to result), gen_ai.operation.name, and the span status set to ERROR with an exception event on failure. Emit the tool call as its own span, child of the model span that requested it.
Can schema validation catch hallucinated parameters? It catches wrong types and missing/unknown fields immediately. It won’t catch a well-typed but nonexistent value (a valid-looking order ID that doesn’t exist). That one surfaces as a “not found” error from the tool, which you then catch and classify.
Why is my overall error rate low but the agent still gives wrong answers? Because a blended error rate averages your high-volume read tools (which rarely fail) with your low-volume write tools (which fail often). Break error rate out per tool; the failing tool is usually hiding in the average.