

Metrics are the backbone of improving AI models. Without them, you’re guessing whether changes help or hurt your system. Here’s the deal: metrics aren’t just numbers - they’re tools to flag issues, refine performance, and ensure your model delivers what users need.
Key takeaways:
-
Types of Metrics : Metrics fall into task-agnostic (general quality) and task-specific (application-focused) categories. Use both for a complete view.
-
Evaluation Approaches : Combine code-based (deterministic, fast) and LLM-based (subjective, nuanced) evaluations for deeper insights.
-
Reference Methods : Reference-based metrics compare outputs to a gold standard, while reference-free metrics assess quality independently.
-
Common Mistakes : Avoid over-relying on benchmarks, single metrics, or surface-level scores. Instead, use a mix of targeted evaluations.
-
Production Tips : Monitor live traffic for shifts, set clear quality thresholds, and regularly validate automated scores against human reviews.
Types of LLM Metrics and How to Read Them
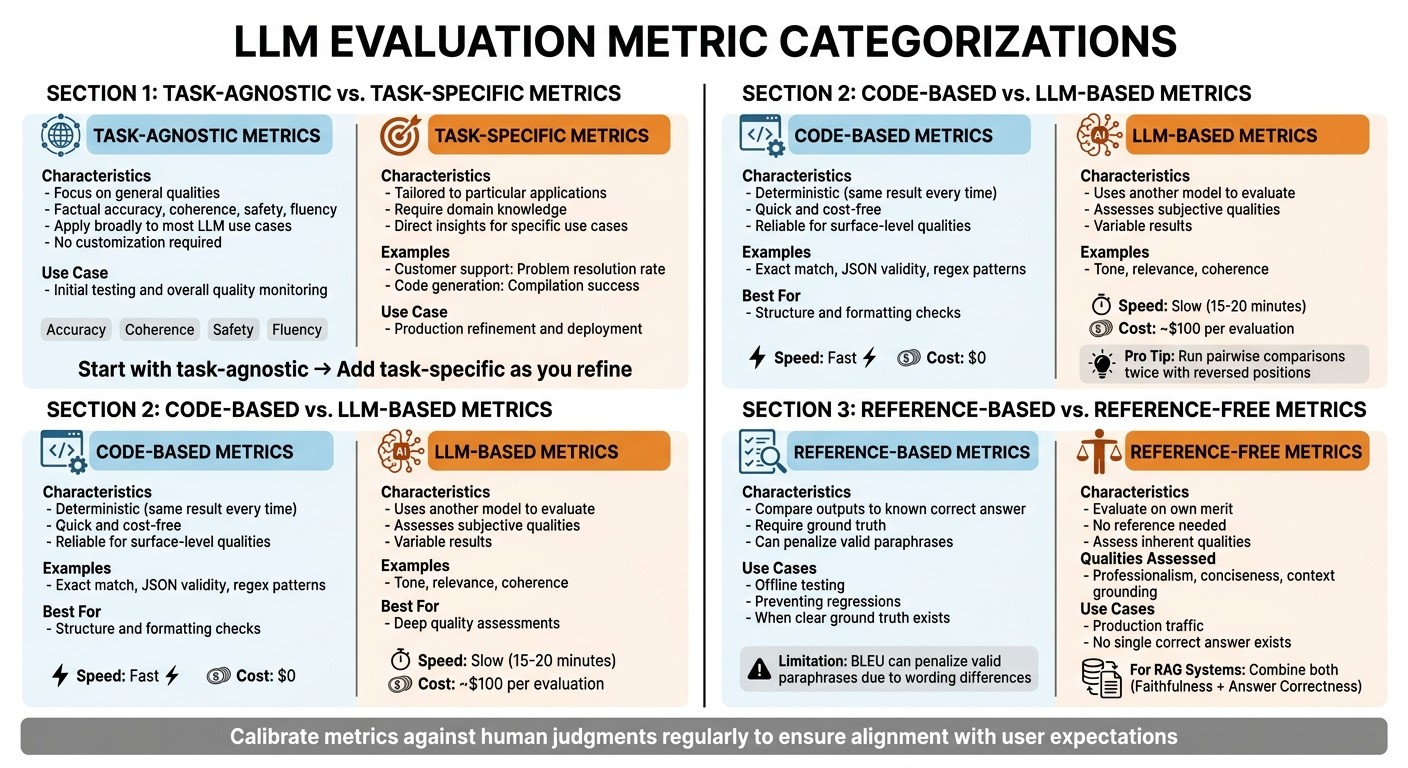
LLM Metrics Types Comparison: Task-Agnostic vs Task-Specific, Code-Based vs LLM-Based, Reference-Based vs Reference-Free
Metrics come in various forms, and understanding the different types is key to interpreting results correctly. Knowing these categories helps you choose the right metrics for your needs and make sense of the data they provide. Here’s a breakdown of the common metric categories.
Task-Agnostic vs. Task-Specific Metrics
Task-agnostic metrics focus on general qualities like factual accuracy, coherence, safety, and fluency. These metrics apply broadly to most LLM use cases without requiring customization. They’re great for initial testing and monitoring overall quality.
Task-specific metrics , on the other hand, are tailored to a particular application. For instance, a customer support bot might rely on metrics like problem resolution rate, while a code generation tool might look at compilation success. These metrics require domain knowledge but offer insights directly tied to your specific application.
The distinction between these two types is crucial. General-purpose evaluations often fail to align with the unique demands of a specific application and may not provide the level of detail needed for production. Start with task-agnostic metrics to establish a baseline, then incorporate task-specific metrics as you refine and deploy your model.
Code-Based vs. LLM-Based Metrics
Code-based metrics are deterministic, meaning they will produce the same result every time. Examples include exact match, JSON validity, and regex patterns. These metrics are quick, cost-free, and reliable for assessing surface-level qualities like formatting and structure.
LLM-based metrics , in contrast, use another model to evaluate outputs. These metrics can assess subjective qualities such as tone, relevance, and coherence - elements that are harder to measure with code. However, they come with trade-offs: they’re slower (evaluations can take 15–20 minutes), costlier (about $100 per evaluation), and introduce some variability. To minimize bias in LLM-based evaluations, it’s recommended to run pairwise comparisons twice, reversing the positions, and then aggregate the results.
Both types of metrics serve different purposes. Use code-based metrics for quick checks on structure and formatting, and turn to LLM-based metrics for deeper quality assessments. Together, they provide a more complete picture.
Reference-Based vs. Reference-Free Metrics
Reference-based metrics compare model outputs to a known correct answer. These are particularly useful in offline testing and preventing regressions when you have a clear “ground truth”. However, they have limitations. For example, lexical metrics like BLEU can penalize valid paraphrases simply because they differ in wording from the reference.
“Reference-based metrics compare output to an expected answer… Reference-free metrics evaluate outputs independently… Use when there’s no single correct answer.” - Braintrust Team
Reference-free metrics , on the other hand, evaluate responses based on their own merit rather than comparing them to a reference. These metrics assess qualities like professionalism, conciseness, and whether the response is grounded in context. They’re ideal for scenarios like production traffic, where a single “correct” answer may not exist. For Retrieval-Augmented Generation (RAG) systems, a combination works best: use reference-free metrics like Faithfulness to ensure the response aligns with the context, and reference-based metrics like Answer Correctness to validate against a gold standard. Regularly calibrating these metrics against human judgments ensures they align with user expectations.
Common Mistakes in Metric Interpretation
Interpreting metrics might seem straightforward, but it’s surprisingly easy to misread them, leading to poor decision-making. To use metrics effectively in production, it’s essential to avoid some common pitfalls. Let’s break down the most frequent errors developers make - and how to steer clear of them.
Using the Wrong Metric for Your Use Case
One common error is mistaking high benchmark scores for production readiness. For example, excelling on benchmarks like MMLU or GSM8K doesn’t guarantee your application will perform well in real-world scenarios. These benchmarks often face issues like data contamination or saturation, where top models exceed 90% performance, making it harder to distinguish between quality levels. As a result, a model that shines in benchmarks may still falter in specialized applications.
The solution? Align your metrics with the specific needs of your task. For instance, in Q&A systems, combine metrics like Factuality and Relevance. For content generation, focus on metrics such as Safety , Coherence , and Fluency. Remember, high benchmark scores don’t automatically translate to production success.
Relying Too Much on Surface-Level Metrics
Metrics like ROUGE and BLEU are popular but often misleading. They focus on word overlap rather than semantic accuracy, which means they may penalize valid paraphrases or reward outputs that aren’t truly meaningful. This can lead to either underestimating or overestimating your model’s performance.
To address this, break your evaluation into smaller, targeted checks rather than relying on aggregated scores. For example, if you’re assessing tasks like API query generation, retrieval relevance, or data extraction, evaluate each aspect separately. This granular approach helps identify issues that surface-level metrics might miss.
Depending on a Single Metric
Optimizing for one metric alone can backfire. For example, focusing solely on factuality might result in outputs that are accurate but dull or unengaging. Moreover, relying on a single metric can lead to inconsistent evaluations. A striking example: 93% of teams using LLMs as judges report reliability issues, with scores varying significantly - like a trace scoring 91 one day and 64 another, even without code changes.
The fix? Use metric triangulation. Combine surface-level, semantic, and human-based evaluations to get a more balanced view. Instead of relying on one judge, assemble a panel of three to five smaller models and require a majority consensus to reduce variability. Additionally, replacing numeric scales with binary yes/no questions has been shown to improve evaluation consistency by 23%.
Next, we’ll dive into how to create a balanced metric scorecard to avoid these common pitfalls.
Building a Balanced Metric Scorecard
To create a balanced metric scorecard, it’s essential to integrate quick, straightforward checks with more detailed semantic evaluations and apply prompt engineering principles to refine model outputs. The goal is to choose the right combination of metrics tailored to your specific needs. By steering clear of common errors, you can develop a scorecard that accurately reflects your model’s performance in real-world use.
Combining Traditional and Semantic Metrics
Start with baseline checks to ensure structural integrity, then build on them with semantic evaluations to assess meaning. For example, metrics like Exact Match or JSON Validity can quickly confirm structural correctness since they’re fast and deterministic. On top of that, use semantic tools like BERTScore or Natural Language Inference (NLI) to evaluate whether the output retains its intended meaning, even if the wording differs from the reference.
A helpful guideline is the “5 Metric Rule”: combine 1–2 task-specific metrics with 2–3 general system metrics. This keeps your scorecard focused and avoids drowning in excessive data. As Jeffrey Ip, Co-founder of Confident AI, wisely notes:
“The truth is, when you’re evaluating everything, you’re evaluating nothing at all. Too much data != good”.
If you’re using LLM-as-judge evaluations, make sure they rely on Chain-of-Thought reasoning before assigning scores. For Retrieval-Augmented Generation (RAG) systems, evaluate retrieval (e.g., context precision/recall) and generation (e.g., faithfulness/relevance) separately. This dual-layer approach helps pinpoint where issues arise, combining basic checks with more in-depth context analysis to set a strong standard for quality.
Setting Quality Thresholds
In production, quality thresholds are vital to prevent performance from slipping. These thresholds turn abstract goals into measurable benchmarks. One way to set them is by having experts label 50–100 outputs as “pass” or “fail”, then using the 10th percentile of acceptable scores as your threshold.
Adjust thresholds to balance false positives and negatives based on the risks of your application. For high-stakes scenarios like medical or legal AI, stricter thresholds are essential - for instance, a toxicity limit of 0.10 or a factuality minimum of 0.85. For creative tasks, you can afford more flexibility. These thresholds should be integrated into your CI/CD pipeline to automatically halt deployments if metrics fall below acceptable levels. Additionally, configure “break-glass” alerts to notify your team immediately if production scores dip below the established minimums.
Choosing Metrics That Matter for Your Application
Pick metrics that align closely with user needs. For example, in customer support, prioritize Answer Relevancy (0.80+) and Faithfulness (0.85+) to ensure responses meet user expectations. In code generation, focus on Correctness (0.90+) and Tool Correctness (0.95+). For summarization tasks, semantic similarity (0.85+) is critical to maintaining the intended meaning, even if the phrasing changes.
To improve your scorecard, analyze production data to identify frequent failure modes - like hallucinations, context loss, or tone mismatches - and choose metrics that address these weaknesses. Regularly calibrate automated scores against human evaluations of 100–200 examples to ensure they reflect actual quality standards. This ongoing alignment helps keep your system reliable and user-focused.
Interpreting Metrics in Production Environments
Once your model is live, understanding metrics becomes a whole new ballgame. Production environments aren’t as predictable as controlled testing setups - your dataset evolves constantly, and outputs can be all over the place. Grasping these dynamics is crucial to keeping your AI systems dependable.
Dataset Dependencies and Limitations
One major challenge is how data quality and availability shift in production. The kind of data you’re working with directly affects which metrics make sense to use. For instance, reference-based metrics like BLEU or semantic similarity rely on high-quality “gold standard” answers for comparison. But here’s the catch: in live production, those perfect answers often don’t exist. When users throw unexpected or entirely new questions into the mix, there’s no pre-written “correct” response to fall back on. This is where reference-free metrics or evaluations like LLM-as-judge come into play. These methods assess quality without needing a predetermined answer.
To make metrics more reliable, curated test collections that cover a wide range of scenarios are essential. Balancing offline evaluations (using curated datasets to catch issues before deployment) with online evaluations (monitoring real-time traffic for unexpected failures or shifts in data distribution) ensures you’re prepared for both predictable and unpredictable challenges.
Handling Non-Determinism and Prompt Sensitivity
LLM outputs are naturally unpredictable, which makes exact-match testing impractical. To counter this, you can stabilize evaluations by setting temperature=0 for LLM-as-judge models. This ensures consistent scoring, even when the outputs themselves are varied. Few-shot prompting - providing around five examples - can also help clarify the task, resulting in more reliable evaluations.
Using multiple judge models in parallel can further reduce variance. Incorporating Chain-of-Thought reasoning in scorer prompts is another smart move. By having the judge explain its reasoning, you can debug disagreements and cut down on noisy or unclear scores. And don’t forget to regularly validate automated scores against human expert judgments to ensure they align with real-world quality standards.
These strategies lay the foundation for monitoring long-term performance effectively.
Tracking Performance Regressions Over Time
Metrics are especially useful for spotting performance dips. For example, a 2–3 point drop on a benchmark like MMLU after fine-tuning could signal a serious issue, such as a loss in the model’s capabilities. Keeping an eye on live traffic helps you catch problems like novel queries or shifts in data distribution as they happen. Comparing current scores to historical baselines can also reveal prompt or model drift.
Set clear release criteria, like minimum score thresholds or limits on regression. For example, you might aim for “no drop in factuality greater than 2%”, which acts as a safeguard for deployments. A great case study here is Notion’s product team. In early 2026, they switched to a systematic evaluation workflow using Braintrust. This shift - from manual spot-checking to a data-driven approach - boosted their issue-resolution rate from just 3 fixes a day to 30. For multi-turn systems, it’s important to evaluate entire conversation flows and overall task completion rather than just isolated responses. This gives you a more accurate picture of how the model is performing.
Implementing Metric Interpretation with Tools and Workflows
Turning insights from metrics into actionable steps requires well-organized workflows to ensure LLM performance stays on track.
Defining Objectives and Selecting Metrics
Start by clearly defining the goals for your use case. For instance, a customer support chatbot might focus on accuracy and safety, while a creative assistant may prioritize fluency and variety. These objectives should directly influence the metrics you monitor and the datasets you use for testing.
Take a legal advice tool as an example. Here, factuality and compliance metrics would take precedence over creative metrics like diversity. To evaluate your model effectively, create a “golden dataset” that mirrors the real-world scenarios your tool will face. This dataset becomes your benchmark for regression testing during development. Use batch testing to compare different prompt versions against this dataset before deploying updates. Keep this dataset relevant by regularly refreshing it with examples from production to avoid drift.
Using Latitude for Automated Evaluation

Latitude simplifies the evaluation process by connecting observability with automated testing. It identifies failure modes based on real production issues, treating them like bugs. Unlike synthetic benchmarks, it generates evaluations from actual production problems, ensuring you’re addressing challenges your users genuinely face.
In live mode, Latitude continuously monitors critical metrics like safety checks, format validation, and relevance. This real-time monitoring catches regressions before they affect users. Its annotation queues allow you to flag anomalies for human review, while alignment metrics measure how closely automated evaluations align with human judgment. By blending automated scans with human oversight, you get both speed and precision. These insights feed directly into ongoing feedback cycles, ensuring continuous improvement.
Creating Feedback Loops for Continuous Improvement
Automated evaluations are just the beginning. To foster continuous improvement, integrate structured feedback into your workflow. Use evaluation results to fine-tune your prompts and run batch evaluations on your updated golden dataset before implementing changes. The “Prompt Suggestions” feature in Latitude can highlight areas for improvement based on recurring failure patterns.
Adopt a tiered review system: rely on automated evaluations for low-risk tasks while reserving expert reviews for high-stakes applications. Track how well your evaluations align over time - if automated scores start diverging from human judgments, adjust your scoring prompts or add more examples. This iterative process of detecting issues, evaluating them, refining your approach, and deploying updates ensures steady progress and better outcomes.
Conclusion
Turning subjective AI quality into actionable insights hinges on effective metric interpretation. As the Braintrust team aptly states:
“You can’t systematically improve what you can’t measure”.
Without metrics, you’re left guessing whether changes enhance or hinder performance.
The takeaway? Strive for balance. Relying solely on one metric - whether it’s BLEU scores or LLM-as-judge evaluations - can leave critical gaps that affect user experience. Instead, adopt a multi-layered approach. Use programmatic rules for safety and formatting checks, LLM-based evaluations for nuanced quality assessments, and reserve human reviews for high-stakes decisions. This combination ensures you catch issues that any single metric might miss.
Consistent tracking is key to avoiding performance regressions. Develop at least one task-specific metric aligned with your core user outcomes. This allows you to maintain consistent evaluations, even when transitioning between models.
Tools like Latitude simplify this process by linking production challenges with automated evaluations. This ensures your focus stays on solving real user problems rather than chasing synthetic benchmarks. By setting up structured workflows - defining clear goals, running batch evaluations, and establishing feedback loops - you can transform metric insights into meaningful improvements.
The message is simple: measure what matters, balance your metrics, and let data guide your iterations. The long-term success of your LLM depends on this disciplined approach.
FAQs
Which metrics should I track first for my LLM app?
When deciding which metrics to monitor, it all comes down to your specific goals. However, a good starting point includes accuracy , relevance , and safety. For faster evaluations, automated metrics like BLEU , ROUGE , and perplexity can be incredibly helpful. But when it comes to more subjective factors, such as tone and safety, human feedback becomes essential. By blending automated metrics for efficiency with human input for deeper insights, you create a well-rounded evaluation strategy.
When should I use reference-based vs reference-free scoring?
Reference-based scoring is ideal when you have clear benchmarks or known answers to compare against. For example, metrics like BLEU or ROUGE are commonly used in tasks like classification or ranking. These methods work best when there’s a defined “correct” output to measure accuracy.
On the other hand, reference-free scoring is better suited for evaluating subjective qualities such as tone, safety, or relevance. Instead of relying on predefined answers, this approach uses criteria like coherence or factual accuracy, often assessed through human feedback or AI-generated rubrics. It’s particularly useful in situations where no definitive “ground truth” exists or when available data is insufficient.
How do I set reliable pass/fail thresholds in production?
To establish dependable pass/fail thresholds, start by defining clear quality criteria rooted in specific failure modes. Metrics like Matthew’s Correlation Coefficient (MCC) should be calibrated against human annotations to ensure accuracy - this is especially crucial when dealing with class-imbalanced datasets.
When it comes to sampling rates, tailor them to the importance of the checks. For example:
-
Use 100% sampling for critical checks to ensure no issues slip through.
-
Opt for 10–30% sampling for less critical checks to balance thoroughness with resource efficiency.
Incorporate automation into your CI/CD pipelines to streamline evaluations. By continuously monitoring thresholds, you can quickly spot regressions and maintain consistent quality in production environments.