
Production LLM agents fail in five recurring operational families: wrong task outcomes, bad tool actions, lost or corrupted state, policy or security violations, and loops or waste. Monitor the full trajectory and resulting world state because a fluent final answer and a successful HTTP response can hide all five.
These categories are a practical synthesis for production monitoring. They are not an exhaustive scientific ontology, and “every agent has” should be read as “every production team needs coverage for these risks.”
What are the five production agent failure modes?
| Failure mode | What goes wrong | What the user sees | Strongest evidence |
|---|---|---|---|
| Task outcome failure | The requested job remains incomplete or incorrect | A confident answer, false confirmation, or unresolved request | Final environment state, task milestones, user feedback |
| Tool and action failure | The agent selects the wrong tool, sends invalid arguments, or mishandles a result | Error, unintended action, or false success | Tool schema, arguments, result, retries, state diff |
| Context and state failure | The agent forgets, overwrites, or misreads information across turns | Repeated questions, contradictory actions, stale assumptions | Full session, memory reads/writes, release and state snapshots |
| Policy and security failure | The agent violates a rule, follows injected instructions, or exposes data | Unauthorized action, refusal error, or unsafe disclosure | Policy decision, untrusted input, permissions, state mutation |
| Loop and efficiency failure | The agent repeats work or fails to stop | Long waits, cost spikes, repeated calls, no progress | Step count, repeated action signature, tokens, latency, outcome delta |
A failure mode describes the observable way the task broke. Its root cause may sit in the model, prompt, tool contract, orchestration code, state store, permissions, or external dependency.
A 2026 preprint analyzed 13,602 closed issues and merged pull requests from 40 open-source agent repositories, then manually coded 385 faults and surveyed 145 practitioners.1 It found five architectural fault dimensions, 13 symptom classes, and 12 root-cause categories. In the survey, 83.8% of practitioners said the taxonomy covered faults they had encountered. The study supports a component-level view of agent failures, though its recent preprint status calls for caution.
1. What is a task outcome failure?
A task outcome failure happens when the agent’s final effect does not satisfy the user’s goal. The response can read well. The API calls can return 200. The database, ticket, reservation, or document still ends in the wrong state.
Examples include:
- claiming a refund was issued when no refund record exists
- answering from the wrong retrieved document
- completing one part of a compound request and dropping the rest
- refusing an allowed request or accepting a disallowed one
- ending the conversation before the user’s goal is resolved
Evaluate outcomes against something outside the final prose. Use database state, explicit milestones, a deterministic business rule, a reference answer for bounded tasks, or human judgment for semantic outcomes.
Tau-bench compares the database state after a conversation with an annotated goal state. In its reported experiments, GPT-4o with function calling reached about 61% pass^1 in retail and 35% in airline tasks. Consistent success across eight retail trials fell to about 25%.2 These benchmark results do not predict a specific production app, but they show why a single successful run is weak evidence of reliability.
Detection rule: define the expected state change or task milestone before checking style or fluency.
2. What is a tool and action failure?
A tool failure occurs when the agent chooses an unsuitable action, emits invalid arguments, ignores an error, or misinterprets a successful response. The external system may reject the call, or worse, accept a syntactically valid action that violates the user’s intent.
Instrument each action with:
| Evidence | Question it answers |
|---|---|
| Tools offered | Could the model choose the correct action? |
| Tool selected | Did it choose the right capability? |
| Validated arguments | Were required fields, types, and identifiers correct? |
| Tool result or exception | What did the environment actually return? |
| Agent reaction | Did it recover, retry safely, or claim success? |
| State diff | Did the action produce the intended effect? |
ToolSandbox evaluates agents in stateful conversations with intermediate milestones and minefields. It identifies state dependencies, canonicalization, and insufficient information as challenging tool-use cases.3 The important production lesson is that tool correctness spans the conversation, action, and resulting world state.
The 2026 fault study found dependency and integration failures in 19.5% of its manually analyzed sample and data/type handling failures in 17.6%.1 Those figures describe its selected open-source fault dataset. They are not universal production rates.
Detection rule: validate the tool contract and compare the resulting state with the user’s intended state.
3. What is a context and state failure?
A context failure happens when the agent loses the information required to act consistently. The missing state may be conversational, external, or stored in a memory system.
Common forms include:
- asking for information the user already supplied
- using a stale account, cart, or reservation state
- forgetting a constraint after several tool calls
- mixing facts between users or sessions
- reading memory successfully but applying the wrong item
- carrying an assumption past a release or data change
Full-session traces matter here. Capture messages, tool calls, memory retrievals, state mutations, prompt and model versions, user and tenant identifiers, and the final outcome. A single failed span may look normal while the contradiction appears three turns earlier.
ToolSandbox’s stateful design tests implicit dependencies between actions. In one type of scenario, a tool cannot work until the agent recognizes and changes a hidden world state.3 This is close to production behavior, where a valid API call can fail because the agent’s model of the environment is stale.
Detection rule: reconstruct the state the agent could see at each decision and compare it with the state its action assumed.
4. What is a policy and security failure?
A policy or security failure occurs when the agent takes an unauthorized action, discloses protected information, follows malicious instructions in data, or applies a domain rule inconsistently.
Indirect prompt injection is especially relevant to tool-using agents. A retrieved email, webpage, ticket, or document can contain instructions that the agent mistakes for trusted control text.
AgentDojo evaluates agents that use tools over untrusted data. Its first version contains 97 realistic tasks and 629 security test cases.4 In the reported setup, current models solved under 66% of benign tasks. Attacks against the best-performing agents succeeded in under 25% of cases, and one secondary detector reduced attack success to 8%.4 These results belong to that benchmark and defense configuration. They show that utility and security need separate checks.
Monitor:
- the source and trust level of every instruction-bearing input
- permission checks before state-changing tools
- policy decisions and cited rule sections
- sensitive fields entering prompts or leaving tools
- user confirmation for irreversible actions
- final environment state and data access logs
Detection rule: evaluate whether the action was authorized and policy-compliant even when it completed the requested task.
5. What is a loop and efficiency failure?
A loop failure occurs when the agent repeats reasoning or actions without meaningful progress. It may alternate between tools, retry the same invalid call, keep asking for unavailable data, or generate tokens after the outcome is already known.
Detect progress at the trajectory level. Count repeated normalized action signatures, unchanged state after actions, duplicate retrievals, step count, tokens, latency, and cost. Add a budget and a termination rule for each workflow.
At Latitude, the built-in Thrashing flagger covers cycling through tools without progress. One real internal artifact caught get_weather being called three times with empty arguments. The occurrence became a tracked issue with sample traces and led to a fix PR. This is useful because “three calls” alone is not the definition. The repeated calls had the same empty arguments and produced no progress.
Efficiency failures can also hide in successful sessions. Latitude has a deterministic Low Cache Hit Rate flagger for multi-turn traces where caching is active but under 30% of tokens are cached. It came from a customer case where randomized tool-payload ordering broke prompt caching and produced roughly 7 times the expected token cost. This is a product-derived example rather than an industry benchmark.
Detection rule: compare each step with the previous world state and stop when the agent repeats an action without new evidence or progress.
How do failure modes differ from root causes?
Do not name the symptom and stop debugging.
| Symptom | Possible failure mode | Possible root cause |
|---|---|---|
| “Done” but record unchanged | Task outcome or tool failure | Tool result ignored, stale state, wrong identifier |
| Repeated request for the same field | Context failure | Truncation, memory write failure, bad state reducer |
| Unauthorized email sent | Policy/security failure | Prompt injection, missing permission gate, policy retrieval error |
| Same tool called repeatedly | Loop/tool failure | Invalid schema, swallowed exception, poor termination condition |
| Empty assistant output | Task outcome failure | Provider error, parser bug, token limit, empty-response handling |
One trace may express several modes. A prompt injection can cause a wrong tool action, which mutates state, then the agent can falsely claim the original task succeeded. Record the chain instead of forcing the incident into one label.
How should you detect these failures in production?
Use a layered monitoring stack:
- Capture complete sessions with trace and span links.
- Record model, prompt, release, user, tools, and environment state.
- Run deterministic checks broadly for empty responses, schema validity, explicit tool errors, repeated calls, budgets, and permission gates.
- Evaluate semantic outcomes on a probability sample plus high-risk cases.
- Group repeated occurrences by behavior and preserve representative traces.
- Track rate and affected sessions over time.
- Promote confirmed failures into regression tests.
The final output should be one signal among several. Task outcome, world-state mutation, policy compliance, and trajectory progress provide stronger evidence for agent behavior.
How does Latitude organize these failures?
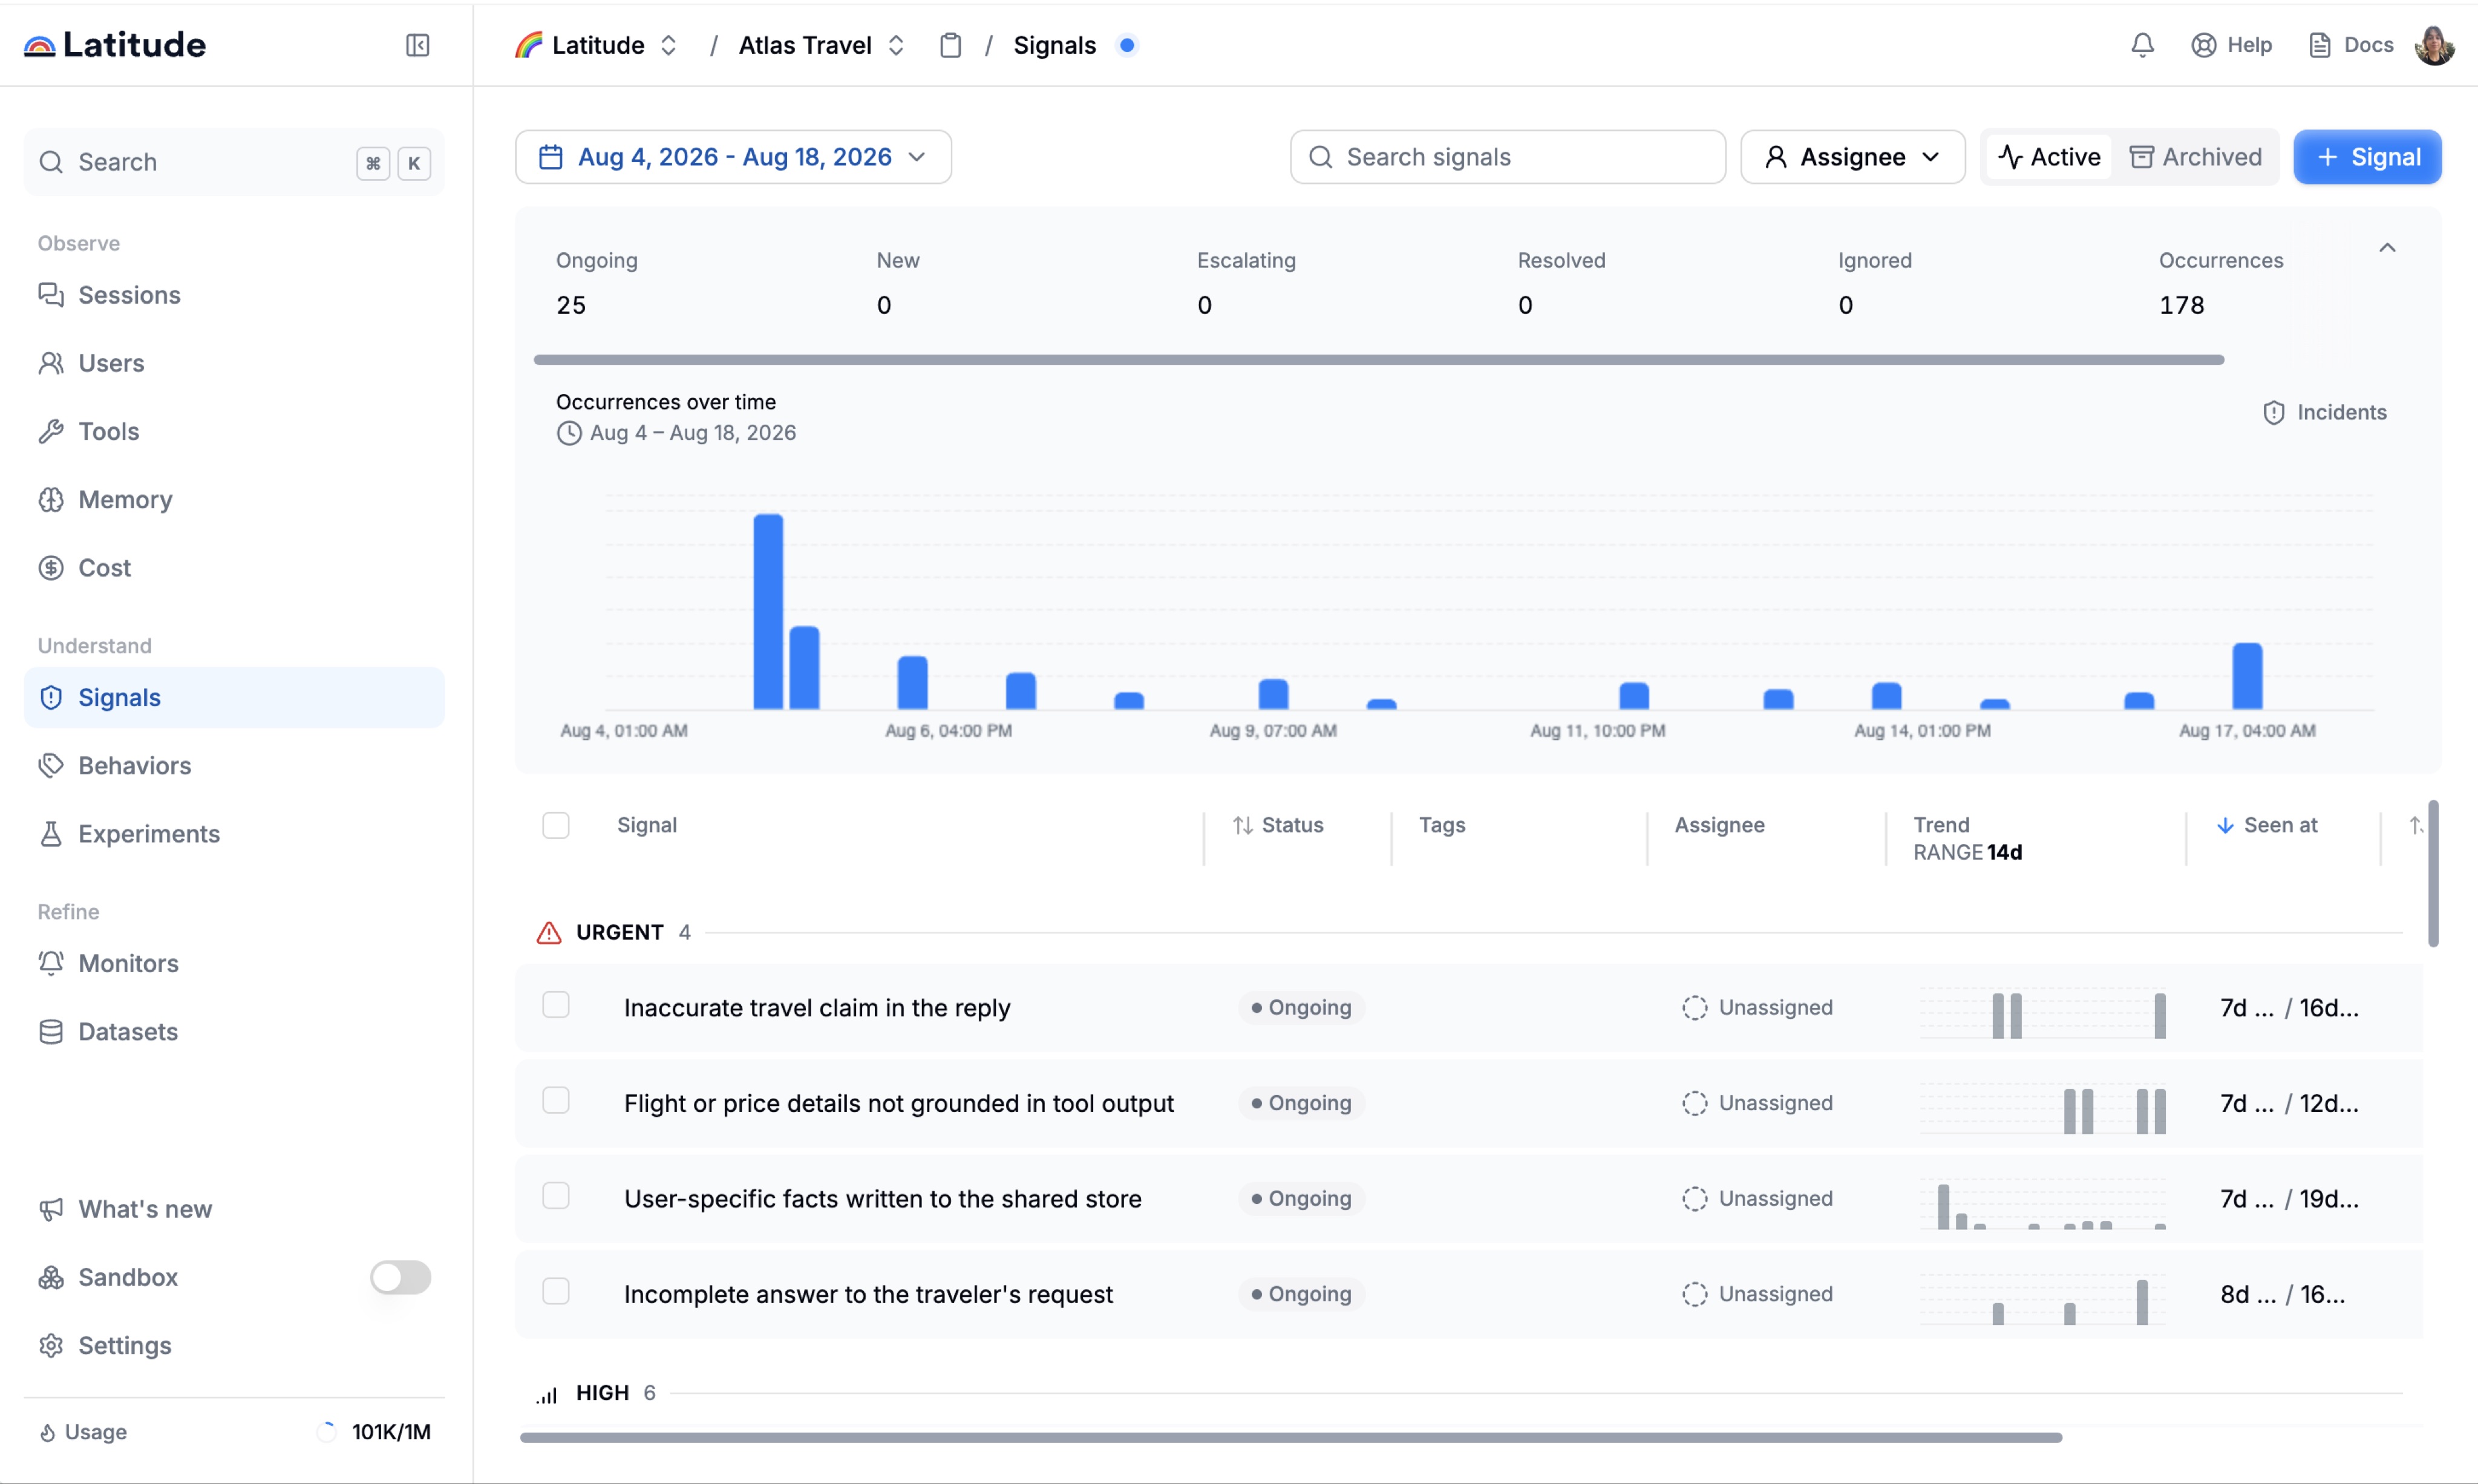
Latitude combines automatic flaggers with semantic grouping and lifecycle-managed Signals.
Deterministic flaggers cover Empty Response, Tool Call Errors, Output Schema Validation, and Low Cache Hit Rate across eligible traffic. LLM-based flaggers cover Refusal, Laziness, Forgetting, Thrashing, User Frustration, Jailbreaking, and NSFW on a 10% default sample that can be increased.
Latitude reports that more than 14% of sessions detect frustration in its own data. The figure comes from Latitude and should not be treated as a general rate for production agents.
A flag is an occurrence. A Signal groups recurring failures, keeps example traces and trends, and moves through a lifecycle. Teams can monitor the Signal, build an evaluation from real examples, and hand the evidence to their coding agent. The coding agent adds the smallest fix and a regression test, then opens a PR. A human controls the merge.
This is how the taxonomy becomes operational. The categories tell you where to look. Signals preserve the specific recurring problem long enough to fix it and verify the trend.
For narrower implementation guides, see detecting tool-call errors, detecting user frustration, and tracking recurring failures.
FAQ
Are these the only five ways an LLM agent can fail?
No. They are operational families that cover common production risks. Detailed taxonomies contain more symptoms and causes, including orchestration, dependency, data handling, and multi-agent coordination failures.
Is hallucination its own failure mode?
Hallucination is usually a mechanism or symptom inside task outcome failure. It can also cause a tool or security failure when fabricated facts become actions. Diagnose the affected outcome and trajectory.
Can a successful tool call still be a failure?
Yes. The tool can accept valid arguments that target the wrong object, violate policy, or fail to achieve the user’s intended state. Check the state change and authorization.
Why monitor sessions instead of individual LLM calls?
Agent failures often propagate across turns and tools. A single call can be locally valid while relying on stale state or contributing to a failed final outcome.
Should an LLM judge every production session?
Usually no. Run cheap deterministic checks across eligible traffic. Use a stable probability sample and targeted high-risk cases for expensive semantic evaluation, then calibrate against human review.
What should become a regression test?
Promote a confirmed failure with a clear expected outcome, representative inputs, required state, and evaluation rule. Keep enough trace evidence to reproduce the original problem.
References
Footnotes
-
Mehil B Shah et al., Characterizing Faults in Agentic AI: A Taxonomy of Types, Symptoms, and Root Causes, 2026 preprint. ↩ ↩2
-
Shunyu Yao et al., tau-bench: A Benchmark for Tool-Agent-User Interaction in Real-World Domains, 2024. ↩
-
Jiarui Lu et al., ToolSandbox: A Stateful, Conversational, Interactive Evaluation Benchmark for LLM Tool Use Capabilities, 2024. ↩ ↩2
-
Edoardo Debenedetti et al., AgentDojo: A Dynamic Environment to Evaluate Prompt Injection Attacks and Defenses for LLM Agents, 2024. ↩ ↩2