Sample size and correlated outputs can skew LLM prompt evaluations—adjust sample calculations, run multiple trials, and prioritize diverse, high-quality test data.

César Miguelañez

When testing prompts for large language models (LLMs), sample size significantly impacts evaluation accuracy. Small sample sizes often lead to unreliable results, ranking errors, and overestimated performance. For example:
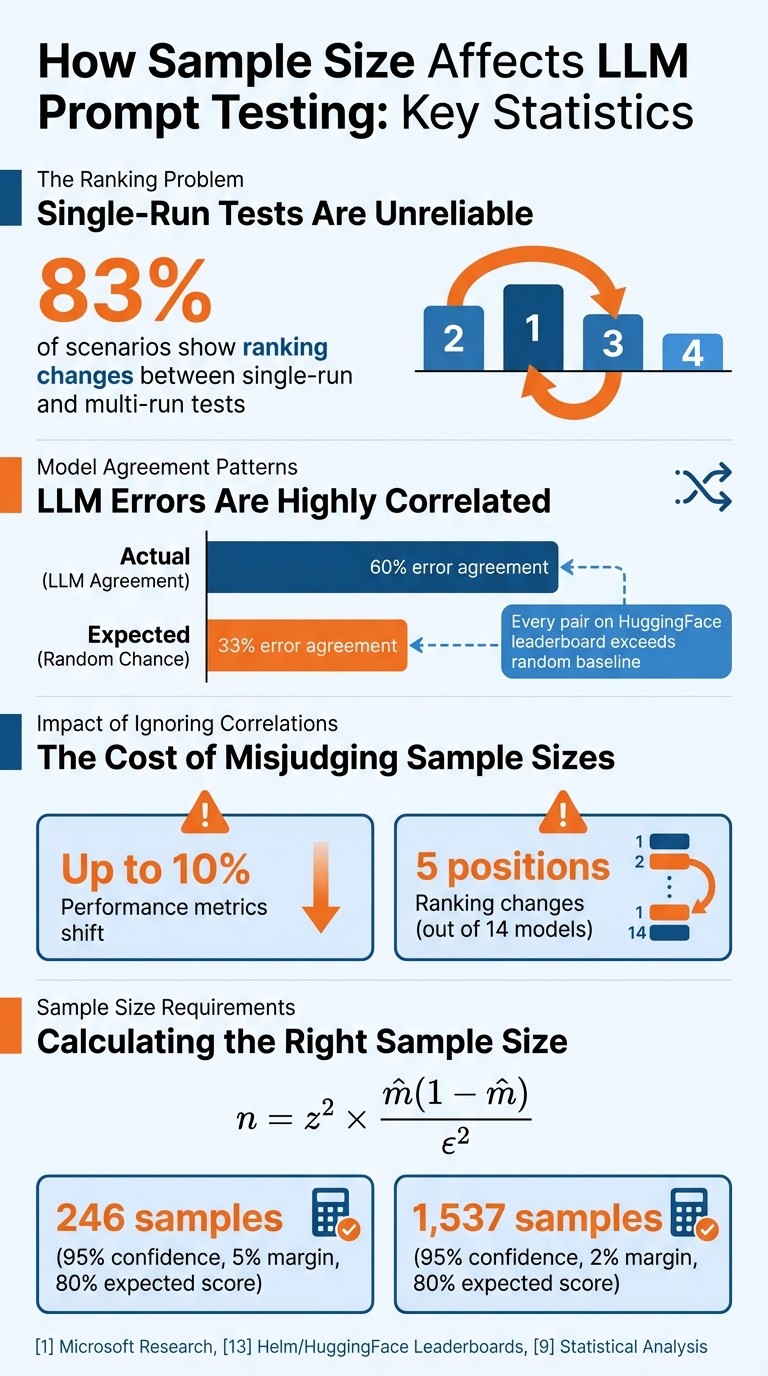
Single-run tests can flip rankings compared to multi-run evaluations (83% of scenarios show changes).
Outputs from LLMs are often correlated, making it harder to get independent results.
Misjudging sample sizes can shift performance metrics by up to 10% and rankings by 5 positions.
Key points to consider:
Correlated Outputs: LLMs often produce similar responses, reducing the true independence of samples.
Sample Size Formula: Use statistical methods to calculate the right sample size, adjusting for correlations.
Model Configurations: Larger models may need more tests to catch subtle mistakes, especially with randomness (e.g., temperature settings).
Data Quality: Focus on diverse and high-quality datasets rather than just increasing volume.
To improve reliability, aim for multiple runs per prompt, account for dependencies, and use tools like Latitude to track performance and gather feedback effectively.
Impact of Sample Size on LLM Prompt Testing Accuracy and Rankings
Statistical Challenges in LLM Prompt Testing
The Problem of Correlated Outputs
When testing large language models (LLMs), one major hurdle is dealing with highly correlated outputs. Unlike standard statistical methods that assume independent and identically distributed samples, LLMs often produce responses that are anything but independent.
Why does this happen? There are two key reasons. First, similar prompts yield similar results. For example, if a model struggles with one type of math problem, it’s likely to falter on similar problems. Second, models share common failure patterns due to their underlying architecture and the data they were trained on. To illustrate, on the Helm leaderboard, when two LLMs both make errors, they agree 60% of the time, far exceeding the 33% agreement expected by random chance. Even more telling, every single pair of models on the HuggingFace leaderboard displayed higher error agreement than random baselines would predict.
"The correlation in model performance across test prompts is non-random... accounting for correlations across test prompts can change model rankings on major benchmarks." - Melissa Ailem, Microsoft Research
This correlation doesn’t just skew individual prompt evaluations; it ripples through the entire evaluation process. In scenarios where one model assesses another - commonly referred to as "LLM-as-judge" - these correlations can artificially inflate accuracy scores. For instance, if the evaluating model and the evaluated model both make the same mistake, the judge might incorrectly mark a wrong answer as "correct". This systematic bias doesn’t just affect isolated cases; it distorts the overall rankings and reliability of LLM performance benchmarks.
Impact of Overestimated Sample Sizes
The issue of correlated outputs also leads to another statistical pitfall: overestimated sample sizes. When these dependencies are ignored, redundant data is mistakenly counted as independent. For instance, a benchmark with 1,000 prompts that are semantically similar might only offer the statistical power of a few hundred truly independent samples. This creates a misleading impression of certainty in the results.
The impact of this oversight is clear. When correlations are accounted for, performance metrics can shift by as much as 10%, and rankings on major benchmarks can change by as many as 5 positions out of 14 models. Misjudging sample sizes leads to overly narrow confidence intervals, misleading p-values, and unstable model rankings.
This problem becomes even more pronounced with smaller datasets. If you’re working with fewer than a few hundred data points, Central Limit Theorem (CLT)-based methods fail to capture the true uncertainty. They produce error bars that are far too small, giving a false sense of precision.
"CLT-based methods for uncertainty quantification... fail to provide adequate uncertainty estimates for LLM evaluations that rely on smaller, highly specialized benchmarks." - Sam Bowyer, Researcher, University of Oxford
These challenges highlight the importance of using tailored statistical methods to account for dependencies and ensure accurate evaluations of LLM performance. Without this, the reliability of testing outcomes remains compromised.
Factors That Affect Sample Size Requirements
Model Configuration Parameters
How you set up your large language model (LLM) plays a big role in determining the number of test samples you'll need. Larger models with more parameters often show greater "prompting stability", meaning they're less likely to be thrown off by slight changes in wording. This consistency can reduce the number of samples required, as outputs tend to be more uniform across similar prompts.
But there's a catch. As models grow in size and undergo processes like instruction tuning or Reinforcement Learning with Human Feedback (RLHF), they may become overly confident in their answers - even when those answers are wrong. This overconfidence means you need more thorough testing to catch subtle mistakes.
"Scaling and shaping currently exchange avoidance for more incorrectness." - Nature
If you use a non-zero temperature setting, which introduces randomness, you'll need to run each prompt two or three times. You can automate these runs via API access to ensure consistency. This helps separate genuine behavior from random noise. Multiple evaluations reduce ranking errors and make your results more reliable.
Interestingly, high performance on tough tasks doesn't always translate to accuracy on simpler ones. Larger models can exhibit "difficulty discordance" - solving complex problems while stumbling on basic ones. To address this, your test set should include prompts of varying difficulty, not just the hard ones. Ultimately, while model configurations influence sample stability, the quality and diversity of training data play a crucial role in fine-tuning these requirements.
Threshold Effects in Training Data
The training data itself is another key factor that impacts sample size needs. After a certain point, quality matters more than quantity. Research shows that performance improvements often plateau once you hit a specific data volume, making the composition of your dataset more important than simply adding more samples. For example, a curated dataset called TuluTalk, with 14% fewer samples than Tulu and 23% fewer than SmolTalk, achieved similar or better results on important benchmarks.
The secret lies in "quality-aware curation" - carefully selecting high-quality inputs with strong reward scores. This method allows you to work with smaller datasets that still perform as well as, or better than, much larger unfiltered datasets. However, there’s a risk: over-filtering your data could remove important task types, like instruction-following or coding, which can distort your results.
If you're planning your sample size, you can use the standard formula: n = z² × m̂(1-m̂) / ε², where z is your confidence level, m̂ is the expected metric score, and ε is the margin of error. For instance, to achieve 95% confidence with a 5% margin of error for a metric expected to score 80%, you'll need about 246 samples. Tightening the margin to 2% raises the requirement to roughly 1,537 samples.
Designing Effective Prompt Testing Workflows
Building on the earlier discussion of challenges and key considerations, this section dives into how to design workflows that effectively test prompts.
Accounting for Intraclass Correlation
When evaluating prompts for large language models (LLMs), it's essential to recognize that outputs from the same model often show a degree of correlation. This is where intraclass correlation (ICC) becomes useful - it measures how much of the variability in results stems from differences in task difficulty versus random noise between trials. ICC values are interpreted as follows: ≥ 0.75 indicates strong reliability, 0.50–0.75 reflects moderate reliability, and below 0.50 suggests poor reliability.
To calculate ICC, a one-way random effects model is typically used. This method separates total variance into two components: variance caused by task difficulty (between-task) and random noise (within-task). For example, in a study evaluating GPT-4o on GAIA Level 3 tasks with 64 trials per prompt, the ICC was 0.304. This result indicated that about 70% of the observed variance was due to randomness rather than meaningful differences in task difficulty. For reliable estimates, aim for a standard error of 0.03, which provides a 95% confidence interval of ±0.06 around the ICC.
A practical tip: ICC tends to stabilize after 8–16 trials for structured tasks, but complex reasoning tasks may need at least 32 trials to yield trustworthy results. When comparing two prompts or models, paired statistical tests - like McNemar's test or paired bootstrap methods - can help ensure that observed improvements are not just due to chance. Reporting both accuracy and ICC together is a good practice to avoid overestimating performance gains.
"As large language models become components of larger agentic systems, evaluation reliability becomes critical: unreliable sub-agents introduce brittleness into downstream system behavior." – Zairah Mustahsan, Lead Author, You.com
Calculating the Right Sample Size
Once statistical challenges are addressed, the next step is determining the right sample size. This is crucial for drawing reliable conclusions. Too small a sample size might miss meaningful improvements, while an overly large sample wastes resources. The formula n = z² × m̂(1 – m̂) / ε² can help calculate the sample size, where:
z is the z-score for the desired confidence level (e.g., 1.96 for 95% confidence),
m̂ is the expected metric score, and
ε is the margin of error.
However, since LLM outputs are correlated, adjustments for this correlation are necessary.
"When sample size is under-estimated, the statistical inference, even with the correct analysis methods, will not be able to detect the true significant improvement leading to misinformed and costly decisions." – Jing Zhou, Jiannan Lu, and Anas Shallah
If you're working within a fixed computational budget, it's often better to test a larger variety of unique items with fewer trials per item rather than overloading a small set with excessive trials. Once the sample size is set, the next step is to implement tools for observability and feedback to complete the evaluation process.
Using Latitude for Observability and Feedback

After determining the proper sample size, tools like Latitude can play a vital role in improving prompt workflows. Latitude is an open-source platform designed to track model behavior, collect human feedback, and run evaluations. It bridges the gap between controlled offline tests and live environments by monitoring metrics like latency, throughput, and error rates.
Pairing human feedback - such as responses to "Was this helpful?" - with behavioral data (e.g., how often users copy, edit, or regenerate AI outputs) can reveal insights that go beyond raw statistics. Latitude also supports collaboration among product teams, engineers, and domain experts, enabling them to refine prompts using real-world production data. This turns static evaluation datasets into dynamic, continuously improving resources.
Conclusion: Key Takeaways for Practitioners
Best Practices for Reliable Testing
When it comes to determining the right sample size, it's all about striking a balance between statistical precision and practical limitations. Quality over quantity is the golden rule - a carefully selected dataset of relevant examples will always outperform a larger, less focused collection. For most tasks, the sweet spot for sample size tends to fall between 439 and 527 examples. Beyond this range, the performance gains start to taper off significantly.
To streamline your evaluations, focus on five key metrics - 1–2 tailored to your specific needs (like G-Eval) and 2–3 general ones (such as faithfulness or relevancy). Using multiple evaluations can also stabilize rankings and provide more reliable insights. These strategies help ensure your sample size is optimized for dependable testing results.
Continuous Improvement in LLM Features
Effective sample testing lays the groundwork for ongoing enhancements, bridging the gap between controlled evaluations and real-world performance. Static evaluations only tell part of the story. To achieve meaningful progress, it's essential to establish a continuous feedback loop by monitoring live performance and incorporating user input.
Tools like Latitude can help integrate evaluation feedback into production workflows. Start small - roll out new prompts to just 5% of traffic to gauge their impact. Segment your evaluations by factors like user group, region, or language to better understand how different audiences respond to changes. Develop a "golden dataset" with hand-annotated ground truth labels for pre-production tests, and use observability pipelines to log live requests and metadata for ongoing analysis. This iterative process not only sharpens prompt performance but also helps refine sample size strategies over time, turning prompt testing into a dynamic and adaptive cycle.
FAQs
Why does sample size matter in testing LLM prompts?
Sample size plays a crucial role in testing LLM prompts because it directly impacts how reliable and accurate the results are. A larger sample size helps minimize the effects of random variations, allowing you to better understand the model's actual performance. This makes evaluations more consistent and trustworthy. On the flip side, smaller sample sizes can lead to skewed or inconclusive results, as they often fail to account for how sensitive LLMs can be to even small changes in prompts.
When the sample size is sufficient, subtle differences in performance become easier to detect, and the evaluations gain the statistical strength needed to provide meaningful insights. This is particularly important when comparing models or assessing improvements where performance gaps may be narrow. In short, choosing the right sample size is key to obtaining reliable and reproducible results when testing LLM prompts.
How do similar errors across outputs impact LLM evaluations?
Correlated outputs in large language models (LLMs) can pose challenges during evaluations because these models often make similar mistakes across various prompts and tasks. This issue is particularly noticeable in models with comparable architectures or training data. Studies have shown that models can agree on errors as much as 60% of the time. This reduces the variety of mistakes, which in turn can undermine the effectiveness of evaluation techniques like ensemble testing.
Such correlations can also distort performance metrics if they aren't properly addressed, resulting in biased evaluations of a model's reliability. To ensure evaluation methods reflect actual improvements rather than shared error patterns, it's crucial to identify and manage these correlations. Tools like Latitude offer structured workflows to monitor and analyze model behavior over time, helping to create evaluations that are both accurate and meaningful.
How can we improve the reliability of LLM prompt testing?
To make testing Large Language Model (LLM) prompts more reliable, it’s important to tackle how sensitive models are to even small tweaks in the wording of prompts. One effective way to do this is by using stochastic evaluation techniques. Instead of relying on a single prompt, this approach involves testing the model's performance across multiple variations of prompts that preserve the same meaning. This helps paint a fuller picture of how the model behaves and minimizes the risk of biases tied to specific prompts.
Another key strategy is analyzing the performance distribution across these prompt variations. By doing this, you can calculate metrics like the median or the top 95% of performance, offering a clearer and more dependable view of the model’s abilities in different scenarios. These methods work across various tasks, models, and evaluation metrics, making them a flexible and practical way to ensure more trustworthy prompt testing.
Using these approaches can greatly boost the reliability and consistency of LLM evaluations, providing deeper insights into how to refine and improve model performance.


