
When large language models (LLMs) fail, the issues are often subtle and unpredictable - like hallucinated facts, ignored JSON rules, or unexplained delays. These aren’t traditional bugs but probabilistic behaviors that are tough to track. The solution? Detailed logging. Logs capture every step: prompt engineering techniques, raw outputs, tool calls, and retrieval contexts. This helps teams pinpoint why an error occurred, not just that it happened.
Key takeaways:
-
Logs provide visibility into LLM decisions, showing why models behave unexpectedly.
-
Types of logs to focus on: request/response logs, error logs, and performance metrics.
-
Common failures include hallucinations, latency spikes, and tool call errors.
-
Using tools like correlation IDs, distributed tracing, and structured JSON logs simplifies debugging.
-
Platforms like Latitude centralize logs, making it easier for teams to analyze and fix issues.
Logs aren’t just records - they’re tools that help teams quickly identify and resolve the root causes of LLM failures.
Why Logs Matter for Debugging LLM Failures
Providing Visibility into Model Behavior
When traditional logs capture failures like a 500 error, a timeout, or a null response, they rarely shed light on why the failure happened. With LLMs, the challenge is even greater because the underlying decision-making process is often a black box. For example, why did the model generate a fabricated answer? Why did it ignore a required JSON schema? Or why did it call the wrong tool with incorrect arguments?
“When an agent gives a wrong answer, conventional logs offer almost no help. You know that it failed, not why.” - Md Sanwar Hossain, Software Engineer
Structured logs change the game by capturing the full context: final prompts, raw outputs, retrieval details, and the sequence of tool calls. This level of detail allows teams to systematically analyze failures. By replaying the exact conditions under which the issue occurred, developers can trace how the model reached its decisions.
Finding Root Causes of Failures
Logs are more than just a record of what went wrong - they help uncover the subtle missteps that cause failures. Because LLMs operate probabilistically, these issues often stem from nuanced problems. For instance, an agent might get stuck in an infinite reasoning loop, repeatedly issuing the same tool call without adjusting its approach. Or, the model might veer off course from its initial objective, or even retrieve irrelevant context that leads it astray.
By analyzing logs, teams can identify these root causes through key indicators like:
-
Quality metrics : Measuring output accuracy and tracking hallucination rates.
-
Performance metrics : Monitoring p95 and p99 latency to spot bottlenecks.
-
Resource usage : Keeping an eye on token consumption and API costs.
For example, a sudden spike in step counts per request often signals an infinite loop, where the agent keeps repeating actions without making progress. Similarly, patterns in tool calls can reveal problems like consistently selecting the wrong tool or passing malformed arguments. Even when explicit errors don’t appear, these insights help pinpoint why the model’s behavior is off track.
Logs aren’t just useful - they’re essential for deploying LLM applications that can perform reliably in production.
Key Log Types Teams Capture for LLM Debugging
To effectively debug large language models (LLMs), teams rely on three main types of logs: request and response logs , error and exception logs , and performance metrics. Each type serves a distinct role in understanding how the model behaves and pinpointing issues. Here’s a closer look at each.
Request and Response Logs
These logs capture every interaction with the LLM, including the final prompt sent, the raw output generated, and relevant metadata like timestamps, user context, and unique identifiers. This data helps teams link events across distributed systems and trace issues back to their source.
Key elements to include in these logs are:
-
Correlation IDs and prompt hashes (e.g., SHA-256) for identifying duplicate requests.
-
A finish reason to indicate why a response ended - like hitting token limits or content filters.
-
For multi-step workflows (e.g., RAG pipelines or agent chains), a trace ID to connect all steps and isolate probabilistic failures.
To ensure consistency and security, teams should format these logs in JSON, use standardized field names, and include a redaction layer to remove sensitive information.
Error and Exception Logs
Error logs are essential for capturing API failures, tool call errors, and unexpected behaviors. Unlike typical software bugs, LLM errors can be probabilistic, making detailed logs crucial for diagnosing intermittent issues like hallucinations or misunderstood instructions.
Some common error codes include:
-
401 errors : Indicate missing or incorrect API keys.
-
429 errors : Signal that rate limits have been exceeded, requiring strategies like exponential backoff with jitter.
-
503 errors : Point to service unavailability or timeouts, often necessitating retry logic.
Distributed tracing can provide additional clarity by documenting what was called, with which parameters, and where failures occurred. Adding automated evaluators, such as JSON schema validators or PII detectors, can further help identify problems before they impact production.
Performance Metrics and Latency Logs
Tracking performance is just as important as logging errors. Performance logs provide insights into system efficiency, response times, and resource usage, helping teams identify bottlenecks that can degrade user experience or increase costs.
Key metrics to monitor include:
-
TTFT (time to first token) : Measures how quickly users see the start of a streaming response.
-
Latency percentiles (e.g., p95, p99): Highlight outlier performance issues.
Resource tracking is another critical component. Logging data on prompt tokens, completion tokens, and total tokens offers real-time visibility into token usage, which directly affects operational costs. This level of tracking also supports budget management and cost control.
Common LLM Failure Patterns Found in Logs
When teams establish strong logging practices, they often uncover recurring failure patterns that can guide more proactive debugging efforts. Identifying these patterns early allows teams to address issues before they escalate. Below are three common types of failures frequently observed in production logs.
Hallucinations and Incorrect Outputs
LLMs can produce hallucinations in anywhere from 3% to 25% of outputs. These range from minor factual errors to outright fabrications, and logs often serve as the first line of defense for catching these issues before they affect users.
Take the example from March 2026: logs from a fintech company revealed that a schema change (renaming annual_income_verified to verified_annual_income) caused the LLM to hallucinate a null value. This error led to improper loan denials but was resolved in just 10 minutes after the malformed tool response was identified. Another case demonstrated how structured logging reduced the time to diagnose agent failures from over three days to under 30 minutes.
Tool call validation plays a crucial role here. Logs that capture inputs and outputs of external API calls can help pinpoint “tool hallucinations”, where the LLM either fabricates arguments or misinterprets malformed JSON. Cross-referencing the model’s outputs against retrieved documents ensures that claims are backed by reliable data. Additionally, integrating confidence scoring into logs can flag outputs where the model shows high uncertainty or provides overly brief justifications. Recognizing these patterns helps teams take the next steps in addressing such issues.
Latency Spikes and Timeout Errors
Logs often reveal performance issues - like latency spikes - before users even notice. Tracking key metrics can help identify these problems early, and strategic caching has been shown to cut costs by 15–30% while improving response times.
Latency issues often appear in logs as specific error codes. For example, HTTP 429 errors indicate rate limit breaches, while 504 errors point to gateway or network timeouts that might require circuit breakers. Monitoring headers like x-ratelimit-reset can help teams implement retry logic with exponential backoff. Hybrid routing systems, which offload simpler requests to smaller models, have achieved a 37–46% reduction in LLM usage.
Using an AI gateway adds another layer of insight, offering features like Prometheus metrics and distributed tracing at the API level. This can help differentiate between model logic errors and provider-side issues, such as 500 errors. Such visibility is invaluable for pinpointing whether slowdowns originate from your infrastructure, the model provider, or downstream services. Recognizing these patterns equips teams to act quickly and effectively.
Tool Call Failures and Post-Processing Errors
Integrating tools with LLMs can lead to partial successes, where initial tool calls succeed but subsequent steps fail due to state or orchestration issues.
Logs often reveal tool misuse through incorrect arguments, improper tool selection, or silent empty responses. Repeated validation across logs can highlight recurring errors in arguments or tool choices. Additionally, retry loops in the logs can signal system stagnation, requiring immediate attention. Monitoring session step counts can also help flag inefficiencies before they drain resources.
Silent degradation - where output quality declines without explicit error codes - is particularly challenging to detect. By tracking quality score trends across sessions, teams can identify when an agent is drifting from its objectives or losing context during extended interactions. Quality evaluations with recall checkpoints can ensure that the model continues to meet its original constraints over time. These patterns provide a roadmap for creating targeted debugging workflows based on log data.
Step-by-Step Workflow for Log-Based Debugging
Step-by-Step Workflow for Debugging LLM Failures Using Logs
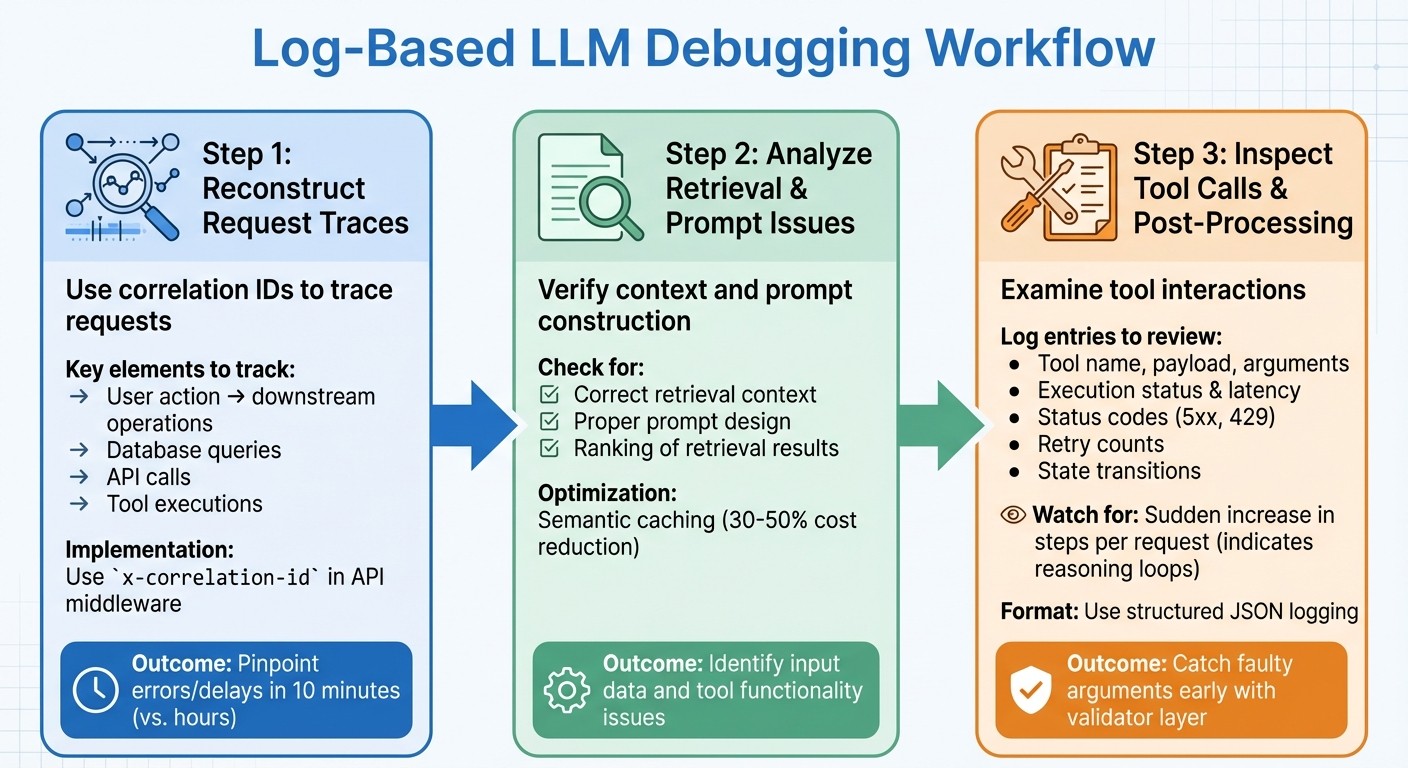
When debugging, the first step is to reconstruct the request trace to figure out what went wrong. A well-structured approach helps teams move from identifying an issue to understanding its root cause - and ultimately fixing it.
Reconstructing Request Traces with Correlation IDs
A correlation ID (or request ID) is a unique identifier assigned at the start of every request. This ID links the user’s action to all related downstream operations, like database queries, API calls, and tool executions. Without it, tracing production issues involving LLM calls becomes nearly impossible.
“Correlation IDs tie a single user request to every downstream operation - database queries, cache lookups, LLM calls, and external API calls. Without them, debugging a production issue involving an LLM call is nearly impossible.” - Grizzly Peak Software Library
Using a correlation ID in your log aggregator allows you to trace requests and pinpoint where errors or delays occur. For example, in March 2026, a fintech company’s loan eligibility agent began wrongly rejecting applicants. By using distributed tracing with correlation IDs, the team discovered that a schema change in an income-verification API caused the LLM to misinterpret a null value. The issue was resolved in just 10 minutes.
To make this work, use API middleware to assign and propagate an x-correlation-id that connects user actions to all downstream operations. Include this ID in response headers and ensure it flows through every function - LLM calls, tool executions, and database lookups. Standardize span attributes (like agent.id, llm.model, and tool.name) across teams to make traces easier to search in tools like Jaeger or Grafana Tempo. Also, redact sensitive data before logging.
Analyzing Retrieval and Prompt Issues
Once you have a complete trace, verify that the retrieval context and prompt construction are correct. Check whether the model received the right context and that prompts were built as expected. Introducing semantic caching can help reduce costs - by 30–50% - by serving cached responses for similar queries. If failures keep happening for similar inputs, it might point to problems with prompt design or the ranking of retrieval results.
This process ensures that both the input data and the tools used afterward are functioning as intended, creating a clear connection between tracing and execution.
Inspecting Tool Calls and Post-Processing
After validating the request traces and prompt context, shift your focus to tool interactions. Look at the tool name, raw payload, and parsed arguments. Keep track of validator outputs and reason codes to separate schema issues from tool-specific problems.
“Tool-calling failures are only fixable at speed when you can say where the first fault happened: selection, arguments, execution, state, or recovery policy.” - OptyxStack
Key log entries should include tool execution status, latency, upstream status codes (like 5xx or 429), and retry counts. When debugging post-processing, log the state transitions after a tool’s return, the fallback path taken, and the final output visible to the user. Use trace_id and span_id to connect a tool’s output with the following prompt, ensuring its results are properly integrated into the workflow.
Structured logging in JSON format is a must for all agent events, as it allows for easier machine parsing and programmatic queries. Log detailed prompt responses at the DEBUG level and keep summary decisions at INFO to save space. Pay attention to the average number of steps per request - a sudden increase could indicate a reasoning loop where the agent repeatedly calls a tool without resolving the issue. To avoid this, use a validator layer to catch faulty arguments early and log the reason codes for rejected inputs.
Using Latitude for Log Aggregation and Analysis

Once you’ve got a solid logging workflow in place, the next hurdle is figuring out how to make sense of all that data. Enter Latitude , an open-source AI engineering platform designed to centralize observability, feedback, and evaluations. It takes your logging setup to the next level, offering tools to streamline debugging and boost LLM performance.
Observability Features in Latitude
Latitude gives you detailed insights into every decision your AI agent makes. Whether it’s a tool call, a reasoning step, or a prompt issue, Latitude helps you pinpoint the exact moment something goes wrong.
“Latitude traces every step your agent takes - every tool call, every reasoning turn - so when something breaks, you know exactly where in the chain it went wrong.” - Latitude
The platform’s Reflect feature automatically groups similar failures, making it easier to identify recurring problems. For example, if multiple users encounter the same hallucination or tool call error, Reflect highlights these patterns so you can focus on the most pressing fixes. Companies using Latitude have reported an 80% drop in critical errors reaching production and a 25% boost in model accuracy within just two weeks of implementation.
Latitude also includes an AI Gateway , which logs prompts, costs, and latency for all LLM calls. Meanwhile, Live Evaluations monitor quality drift and safety issues in real time. To make things even easier, the Prompt Refiner analyzes failures and suggests improved prompt instructions, enabling teams to iterate prompts up to 8 times faster.
This level of visibility doesn’t just make debugging easier - it creates a solid foundation for teams to work together more effectively.
Collaboration Across Teams
Fixing LLM issues isn’t just an engineering task; it needs input from product managers, domain experts, and prompt engineers. Latitude’s shared workspaces bring everyone together by centralizing logs and experiments, making it easy for cross-functional teams to review traces and annotate failures collaboratively.
The platform’s human-in-the-loop feature allows experts to flag and annotate agent responses, offering valuable context that engineers might miss. For instance, a product manager can label a response as “too verbose” or note that it’s “missing key information.” This feedback is then seamlessly integrated into the debugging process, ensuring that improvements address both technical issues and user needs.
Best Practices for Log Analysis
Good logging practices can save countless hours of debugging. By adhering to these standards and focusing on key metrics, you can ensure a reliable and scalable system.
Defining Clear Logging Standards
When operating at scale, structured JSON logging is a must. While unstructured logs might suffice for small-scale operations, they quickly become unmanageable when dealing with thousands of requests, such as large language model (LLM) calls. Every log entry should follow a consistent JSON schema with predefined field names, making logs easy to search and index without extra parsing.
For every LLM call, make sure to automatically capture these key metadata fields:
| Field | Why It Matters |
|---|---|
correlation_id |
Links the LLM call back to the original user request. |
prompt_tokens |
Tracks input costs and ensures budget control. |
completion_tokens |
Monitors output costs for budget management. |
latency_ms |
Helps with SLA monitoring and tuning timeouts. |
temperature |
Explains output variability and maintains reproducibility. |
prompt_hash |
Enables deduplication and searches without storing sensitive user data. |
Implement PII redaction using regex to filter out sensitive information like emails, Social Security numbers, and credit card data. Beyond compliance, this builds user trust and mitigates the risk of costly data breaches.
Set clear log levels to streamline debugging and monitoring:
-
DEBUG : For detailed logs during development.
-
INFO : For standard metadata in production.
-
WARN : For retries or fallback scenarios.
-
ERROR : For capturing failures.
Once your logging standards are in place, shift your attention to monitoring the metrics that matter most for system performance.
Prioritizing Key Metrics and Events
Not all metrics are created equal. Focus first on quality metrics like accuracy, hallucination rates, relevancy, and coherence. These directly influence user experience. Performance metrics, including p95 and p99 latency, come next. For user-facing apps, safety metrics like bias detection and prompt injection detection are equally critical.
To keep tabs on quality without overspending, use LLM-as-a-judge to evaluate a random 5–10% sample of production traffic for relevance and accuracy. This approach provides valuable insights while staying cost-effective. Configure rolling window alerts based on 15-minute or hourly averages to avoid false alarms caused by non-deterministic model behavior.
Keep an eye on output length distributions. A sudden doubling in response length can signal silent model updates or prompt drift, both of which can drive up costs. Similarly, track changes in refusal rates, as these might indicate updates to content filtering policies by your provider.
Regular reviews of these metrics ensure they evolve alongside your system’s needs.
Regularly Reviewing and Iterating on Logs
Conduct weekly regression tests using your Golden Dataset to catch model drift, even if no code changes have been made. This proactive step allows teams to detect silent model updates before users report issues.
Review your monitoring setup monthly to refine alert thresholds and update metadata as needed. As your product matures, certain metrics from early stages may lose relevance, while new failure patterns may emerge that require different logging strategies.
Drift detection should be a continuous effort. Look for gradual changes in topic clusters, sentiment trends, or reasoning patterns that might signal the need for prompt updates. These subtle shifts often precede larger issues, giving you a chance to address them before they affect users.
Conclusion
Effective debugging relies on having clear visibility into production systems, not on achieving perfect models. Teams that excel are those who prioritize logs as a crucial tool, rather than treating them as an afterthought. Majid Sheikh, CTO of Agents Arcade, captures this perfectly:
“The teams that struggle aren’t the ones with weaker models or worse prompts. They’re the ones flying blind”.
Using structured logs shifts efforts from reactive fixes to proactive enhancements. They allow for early identification of issues - like hallucinations, latency spikes, or tool call errors - by summarizing essential metadata. Unlike traditional monitoring, LLM observability deals with multi-step reasoning chains , where errors may be nuanced, and latency can fluctuate significantly depending on the model’s reasoning path. This deeper level of observability transforms uncertainty into actionable insights.
Smart teams focus on tracing errors while sampling successful outputs to manage storage costs effectively. Techniques like semantic caching and evaluator-based filtering can cut deployment costs by 30–50% and reduce investigation time by as much as 20x.
Establishing a robust workflow is equally crucial. Platforms like Latitude facilitate cross-team collaboration by centralizing observability and feedback loops, enabling product, engineering, and domain teams to continuously refine LLM-powered features.
At its core, effective log analysis depends on discipline and iteration. By setting clear logging standards and paying attention to metrics that directly influence user experience, teams can spend less time resolving issues and more time creating impactful features. This disciplined focus not only reduces downtime but also drives continuous system improvements.
FAQs
What should I log for each LLM request?
To ensure effective debugging and observability for each LLM request, it’s crucial to log the following details:
-
Full Prompt : Include the system prompt, user input, and any relevant context provided.
-
Full Response : Record the complete response generated by the model.
-
Token Usage : Track the number of tokens used in both the prompt and the response.
-
Latency : Measure the time taken to process the request.
-
Errors : Log any errors encountered during the request, including details about their nature and potential causes.
-
Model/Version : Specify the model and version used for the request.
-
Timestamp : Capture the exact time the request was made.
-
Metadata : Include any additional relevant information, such as user ID, session details, or request origin.
By collecting this information, you can analyze the model’s behavior, pinpoint issues, and improve performance over time.
How do correlation IDs help debug agent workflows?
Correlation IDs are a powerful tool for engineers working with complex, multi-step agent workflows. These IDs act as a thread, connecting logs, tool calls, and responses, which makes it easier to trace the entire journey of an operation.
By linking each step together, correlation IDs help identify exactly where errors or failures occur in nondeterministic AI processes. This targeted approach not only saves time but also makes debugging far more efficient.
How can I log prompts safely without exposing PII?
To safely log prompts while safeguarding personal information, it’s vital to use a privacy-safe observability pipeline. Here’s how you can do it:
-
Redact sensitive data : Remove any personally identifiable information (PII) from the logs to ensure no private details are exposed.
-
Apply hashing for anonymization : Use hashing techniques to anonymize data while still enabling pattern recognition and analysis.
-
Sample logs : Instead of logging everything, collect a representative sample to reduce the risk of storing unnecessary data.
-
Enforce access controls : Restrict who can access the logs, ensuring only authorized personnel can view or analyze them.
These practices allow logs to remain useful for debugging and reviews while minimizing privacy risks and supporting compliance with data protection standards.