Four practical steps to debug LLM API calls—set up distributed tracing, log prompts/responses, fix auth and rate limits, and trace multi-step workflows.

César Miguelañez

Debugging LLM (Large Language Model) API calls requires a structured approach to solve issues like inaccurate responses, latency spikes, and schema errors. Unlike traditional software, LLMs fail in subtle ways, such as generating incorrect outputs or ignoring context. Here's how to tackle these challenges effectively:
Track Everything: Log raw prompts, responses, token usage, latency, and errors to gain full visibility.
Common Issues: Address authentication (401), rate limits (429), and credit errors (402). Debug hallucinations, schema violations, and RAG (Retrieval-Augmented Generation) failures systematically.
Observability Tools: Use distributed tracing to link every step of the workflow, helping to pinpoint failures in multi-step processes.
Advanced Debugging: Experiment with prompt engineering concepts, validate outputs, and use real-time evaluations for quality control.
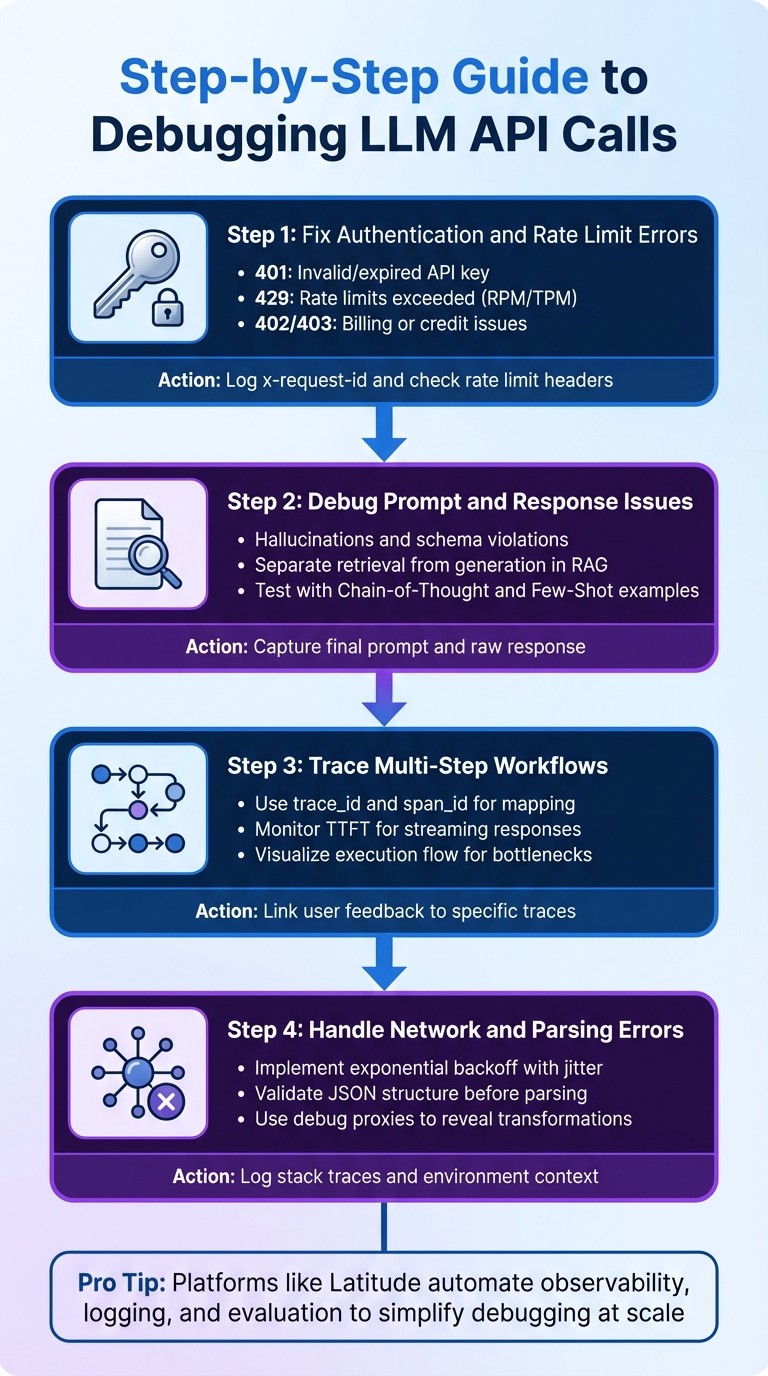
Quick Tip: Platforms like Latitude simplify debugging by automating observability, logging, and evaluation, making it easier to address issues at scale. This guide dives into actionable steps to improve reliability and performance in LLM-powered applications.
4-Step Process for Debugging LLM API Calls
Setting Up Observability for LLM API Calls
To debug effectively, you need clear insights into how your LLM workflows operate. This means implementing structured observability that captures every detail of each API call - a must for any production-level LLM application.
The industry has largely moved beyond basic logging to distributed tracing. Instead of relying on scattered timestamps, distributed tracing weaves every step of a request - like vector database queries, model inference, and post-processing - into a cohesive story. This approach allows you to pinpoint the exact source of issues, whether it's a latency spike during retrieval, a generation error, or a parsing failure. With this framework in place, you're set up for the granular metric collection we'll explore next.
What Data to Log for Debugging
Capturing the right data at each stage of the LLM pipeline is essential for debugging. At the very least, log the raw user query, the finalized prompt (after templating and context injection), and the unedited model response. Without these, you'll lack the context needed to address issues effectively.
Performance data is just as critical. Track metrics like total latency, average response times, and Time to First Token (TTFT) for streaming applications. Log both input (prompt) tokens and output (completion) tokens to calculate API costs down to the request or feature level. Additionally, record the model name, version, and parameters such as temperature, top_p, max_tokens, and stop sequences - these details are vital for understanding and comparing behaviors across configurations.
For workflows involving extended conversations or complex processes, use unique trace IDs to connect related spans, session IDs to track ongoing interactions, and user IDs to isolate specific user actions. Also, log success/failure statuses, error messages, and stack traces for failed calls. If you're running a Retrieval-Augmented Generation (RAG) system, include the retrieved documents that were incorporated into the prompt to assess their relevance and reliability.
Here’s a quick breakdown of key metric categories and their priorities:
Metric Category | Key Indicators | Monitoring Priority |
|---|---|---|
Performance | Response latency (p95, p99), throughput, TTFT | High |
Quality | Output accuracy, consistency, hallucination rates | Critical |
Resource Usage | Token consumption, API costs | Medium |
Safety | Content filtering effectiveness, toxicity, bias | High |
Using Latitude for Observability
When you have access to robust data, troubleshooting becomes much simpler. Latitude steps in as both an AI gateway and an observability platform, automating the process of prompt fetching, execution, and logging. This means you don’t need to manually tweak code for every API call. By routing LLM calls through Latitude's SDK or API, you gain automatic spans and traces that map out how an agent operates, revealing precisely where multi-step workflows might stumble.
Latitude also uses SSE to provide real-time updates on statuses like step-started or step-completed. It logs key metrics such as finishReason, tokenUsage, and providerLogUuid, while integrating with OpenTelemetry to trigger alerts that identify issues down to the prompt version level. This allows you to compare how different prompt versions perform in terms of speed, cost, and output quality.
Alfredo Artiles, CTO at Audiense, captures the value of Latitude perfectly:
"Latitude is amazing! It's like a CMS for prompts and agents with versioning, publishing, rollback… the observability and evals are spot-on."
Latitude also supports human-in-the-loop evaluations via its annotate endpoint, enabling you to log feedback scores and refine prompts based on real-world performance. For teams that prefer more control, Latitude offers a logs.push() method and SDK tools for manual telemetry uploads.
Step-by-Step Guide to Debugging LLM API Calls
Once you've set up observability, you can address specific problems in a structured way. These steps focus on common issues that arise with LLM API operations, building on the basics of observability.
Step 1: Fix Authentication and Rate Limit Errors
Authentication and rate limits are often the first hurdles. A 401 error usually means your API key is invalid or expired, while 429 errors indicate you've hit your provider's rate limits - whether that's Requests Per Minute (RPM), Tokens Per Minute (TPM), or concurrent connection thresholds.
To troubleshoot:
Turn on verbose logging to capture HTTP status codes and error messages.
Ensure the
Authorizationheader follows the correctBearer <API_KEY>format. Some providers may require additional headers likeX-API-KeyorX-Goog-API-Keyfor proxy routing.For 402 or 403 errors, check your account balance or ensure billing is enabled for the specific model you're using.
If you're facing 429 errors, inspect response headers like
x-ratelimit-remaining-requestsandx-ratelimit-reset-requeststo determine how long to wait before retrying.
Always log the x-request-id header for every call. This unique ID is crucial for resolving persistent issues with provider support. If you're streaming responses, be aware that rate limits can sometimes trigger after a 200 OK header, embedding an error object in the final Server-Sent Events (SSE) chunk.
Error Code | Common Cause | Resolution |
|---|---|---|
401 | Missing or incorrect API key | Check environment variables and "Bearer" prefix |
402 | Account out of credits | Add funds via the provider's billing dashboard |
403 | Billing not enabled or moderation flag | Enable billing or review flagged metadata |
429 | Exceeded RPM/TPM or concurrent limits | Use retries and check |
Step 2: Debug Prompt and Response Issues
When API calls succeed but responses are off-target, the problem often lies in semantic failures like hallucinations, schema violations, or mismatched outputs. These require a different approach than infrastructure errors.
First, determine whether the issue is structural, retrieval-related, or semantic. Capture the final rendered prompt and raw response to diagnose the root cause.
For Retrieval-Augmented Generation (RAG) systems, separate the retrieval step from generation. If retrieval metrics like Context Recall and Precision are high but answers are still wrong, the problem likely stems from the prompt or model capabilities, not the vector database. Use a playground environment to import failure traces and test solutions. You can experiment with:
Chain-of-Thought prompting (guiding the model to "think step-by-step")
Few-Shot examples (providing 2–3 reference answers)
Adjusting parameters like temperature and top_p
"LLMs are non-deterministic, stochastic engines that are prone to failing in unexpected ways."
Kuldeep Paul, AI Engineer
For structural issues like JSON parsing errors, use deterministic checks like regex or JSON schema validation to catch problems early. To improve semantic quality, try "LLM-as-a-Judge" evaluations, where a stronger model assesses the output of your production model. Maintain a "Golden Dataset" of high-quality reference answers to run regression tests whenever you tweak prompts.
Log essential details like model version (e.g., gpt-4-turbo-2024-04-09) and parameters such as temperature. These are critical for reproducing non-deterministic issues. Even at temperature 0, LLMs can produce varying outputs, so detailed logs are key. Once you've resolved prompt and response issues, you can move on to debugging multi-step workflows.
Step 3: Trace Multi-Step Workflows
Complex workflows, such as agentic chains or RAG pipelines, require a more detailed debugging approach since single-call troubleshooting won't suffice. You'll need to track how data flows through each step to identify where things go wrong.
Using your observability setup, trace each component with unique trace and span IDs. A trace represents the entire workflow, while spans cover specific operations like vector database queries, LLM API calls, or tool executions. Assign a unique trace_id to every request and use parent_id or span_id to map relationships between steps, forming a directed graph of the execution flow.
For multi-turn conversations or workflows involving agents, use a session_id or group_id to link related traces over time. Collect detailed metadata for every step, including raw inputs and outputs, rendered prompts, model versions, temperature settings, and token usage.
Also, log non-LLM steps like retrieval or embedding generation. Visualize the execution flow to pinpoint latency bottlenecks, whether from slow database queries, long model inference times, or inefficient post-processing. For streaming responses, monitor Time to First Token (TTFT), as this metric heavily influences user experience.
"A trace connects all related events into a single coherent story. It shows not just what happened, but in what sequence... and how one operation's output became the next operation's input."
Sharon Campbell-Crow, Technical Writer, Comet
Tie user feedback to specific traces using trace IDs. Add UI elements like thumbs up/down ratings and log feedback through an annotate endpoint. This allows you to filter and analyze traces linked to poor user experiences.
Step 4: Handle Network and Parsing Errors
Network timeouts and parsing errors are tricky because they tend to be sporadic and depend on the environment. These require robust error handling to mitigate their impact.
With your debugging and tracing setup in place, handle these errors by wrapping API calls in try-except blocks. Log detailed error events, including stack traces and messages, to your observability platform. For network timeouts, use exponential backoff with jitter to avoid overloading the system during outages. Adjust timeout settings based on your use case; for instance, streaming responses may need longer timeouts than single-shot requests.
For JSON parsing errors, validate the structure before parsing. Use deterministic checks to catch malformed outputs early. If size limits are an issue, note that some providers (like Azure API Management) break messages into 32 KB chunks, with a maximum of 2 MB per message. Use a CorrelationId to piece together full requests or responses from multiple log entries.
Debug proxies with echo features (e.g., OpenRouter's debug: {echo_upstream_body: true}) can reveal how your request is being transformed before it reaches the provider. This helps uncover hidden parameter issues or unexpected transformations causing downstream parsing errors.
Finally, ensure you log enough context - inputs, environment details, and stack traces - to recreate edge cases from production.
Advanced Debugging Techniques with Latitude
Once you've got the basics of debugging LLM API calls down, Latitude steps in with advanced tools designed for ongoing improvement and teamwork. These tools are especially useful when tackling production-level debugging challenges. Here's how Latitude's evaluation and collaboration features can take your debugging process to the next level.
Collect Feedback and Run Evaluations with Latitude
Latitude provides two key modes for evaluations: Batch Mode and Live Mode. Batch Mode allows for regression testing using golden datasets, while Live Mode focuses on real-time monitoring of production logs to immediately detect performance issues.
Feedback is gathered through a combination of methods, including automated scoring by LLM-as-judge, deterministic programmatic rules, and expert reviews for subjective metrics.
For critical quality metrics, such as safety, you can enable "Live Evaluation" to catch regressions as they happen. Using golden datasets, you can ensure that prompt updates don’t unintentionally cause new issues. Latitude also offers tools like "Prompt Suggestions" and the "Prompt Refiner", which analyze failed cases and provide actionable recommendations to improve your prompts - saving you from the tedious trial-and-error process.
"Tuning prompts used to be slow and full of trial-and-error… until we found Latitude. Now we test, compare, and improve variations in minutes with clear metrics and recommendations."
Pablo Tonutti, Founder, JobWinner
While advanced evaluation tools make feedback collection more efficient, collaboration is what turns that feedback into meaningful improvements.
Collaborate on Debugging with Latitude
Debugging production-level LLM features often requires input from a variety of roles - developers, product managers, and domain experts. Latitude simplifies this process with shared workspaces, which centralize agents, experiments, and evaluation results. This allows everyone to track progress and review performance in one place. These workspaces bring together logs and traces, offering detailed failure analyses that show every reasoning step and tool execution leading to the final output. When issues arise, any team member can quickly identify the exact point of failure.
Latitude's observability logs make it easy to share specific failure traces with domain experts. These experts can then provide structured feedback through the manual evaluation interface. Before rolling out any changes, you can run batch evaluations against golden datasets to ensure new prompt versions don’t disrupt existing functionality. Plus, with over 2,800 two-way integrations and support for custom tools and APIs, Latitude seamlessly connects with your internal systems and external apps, making it easier to debug even the most complex workflows.
"The observability and evals are spot-on, plus you get logs, custom checks, even human-in-the-loop. Orchestration and experiments? Seamless."
Alfredo Artiles, CTO, Audiense
Conclusion
Debugging LLM APIs is a whole different ballgame compared to traditional troubleshooting. Instead of focusing on stack traces or error codes, you need tools like distributed tracing, statistical evaluations, and structured scenario testing to identify the subtle, often silent failures that can disrupt AI systems. Adding to the challenge, the same prompt might yield different results on separate runs, making traditional reproduction-based debugging methods far less effective.
A strong data collection process is key to tackling these challenges. By ensuring every API call is transparent, debugging becomes less of a guessing game and more of a precise investigation. This approach helps pinpoint exactly where things go wrong in multi-step workflows - whether it’s a retrieval failure in a RAG pipeline or a hallucination during text generation.
Another critical aspect is creating golden datasets and running regression tests before rolling out any prompt changes. These practices help maintain performance across different scenarios. When paired with observability tools, they ensure your model performs consistently. Platforms like Latitude make this process more efficient by combining observability with evaluation tools and collaborative features. These allow teams of engineers and domain experts to version prompts, analyze failures, and fine-tune models using real-world production data.
"Debugging these systems requires a fundamental shift in mindset and tooling. It requires moving from simple logging to complex distributed tracing, from unit tests to probabilistic evaluations, and from ad-hoc fixes to systematic simulation." - Kuldeep Paul
The leap from prototype to production - often referred to as the "AI Engineering Valley of Death" - requires precision and structured workflows. By adopting the strategies outlined in this guide, including distributed tracing, regression testing, and collaborative tools, you can create LLM features that perform reliably at scale, ensuring they serve thousands of users effectively - not just work on your local machine.
FAQs
What are the common issues when troubleshooting LLM API calls?
When working with LLM API calls, debugging often reveals a few recurring challenges:
Content issues: Sometimes, the model generates incorrect or completely made-up information (hallucinations). It might drift away from the intended context or return data in an incorrect format, like improperly structured JSON. Other times, it may produce vague, unsafe, or biased outputs that fail to meet safety standards.
Performance problems: You might notice slower-than-expected response times, excessive token usage, or issues with rate limits and quotas. These hiccups can result from timeouts, network instability, or misconfigured parameters like temperature or max tokens.
Operational risks: Debugging tools, if not managed carefully, can expose sensitive information like API keys. This is especially risky in production environments, where security is critical.
Platforms like Latitude can streamline debugging by centralizing error monitoring, tracking response times, and analyzing token usage. They also offer tools for managing prompts in a structured way, helping to prevent repeat issues.
What is distributed tracing, and how does it enhance LLM API observability?
Distributed tracing ties together every aspect of an LLM API request - starting from the initial API call to data retrieval processes and tool interactions - into one cohesive trace. This consolidated view offers detailed insights into latency, errors, and the interplay between various components.
With the ability to visualize the entire workflow, engineers can pinpoint bottlenecks, resolve issues efficiently, and fine-tune system performance. This approach not only speeds up debugging but also helps maintain seamless operation of features powered by LLMs.
What information should I log to effectively debug LLM API calls?
To troubleshoot LLM API calls effectively, it's crucial to log essential details for every request and response. Start by recording the prompt you send, the completion you receive (or error details if the call fails), and the model identifier (like the model name or deployment ID) to ensure you can replicate requests accurately. Keep track of token usage - including prompt, completion, and total tokens - to monitor both costs and performance metrics. Additionally, log precise timing data, such as start and end times, total response time, and time-to-first-token for streaming calls. Don't forget to include the HTTP status or a success flag to capture the outcome of each call.
Include cost data (in USD), such as the total cost of a response and any detailed breakdowns, to identify unexpected charges. Use traceability fields like unique request IDs, trace IDs (to link related calls), end-user identifiers, and IP addresses for better tracking. It's also helpful to log metadata - for example, request tags, cache flags, and custom fields like environment, version, or feature flags. These details not only make it easier to reproduce issues but also allow for in-depth performance analysis and cost tracking.
Latitude’s open-source platform streamlines this process by bringing together logged data - such as request IDs, token counts, latency, costs, and error details - into a single, unified dashboard. This makes debugging straightforward for engineers and domain experts, ensuring all API calls are observable, searchable, and easy to replicate in production environments.


