
By Latitude · Updated March 2026
Key Takeaways
-
Basic LLM logging misses the failure modes that matter most for agents: context loss across turns, tool argument errors, retry loops, and silent quality degradation.
-
The critical architectural distinction: agent-native platforms capture causal step dependencies; LLM-first platforms log independent events requiring manual correlation at scale.
-
A tool called with wrong arguments at step 3 can silently corrupt steps 4 through 9 — with zero error codes raised and no alert fired.
-
Automatic failure clustering reduces production incidents from hundreds of individual log entries to a prioritized list of actionable patterns.
-
The highest-leverage monitoring investment is closing the loop: platforms that convert production failures into regression tests — and, in Latitude’s case, connect your coding agent (Claude Code, Cursor, and similar) via an MCP server to drive a detected issue toward an opened PR — deliver compounding engineering ROI.
When your AI agent misbehaves in production, the question isn’t whether you’ll notice — it’s whether you’ll notice before users do, and whether you’ll be able to explain what happened and prevent it from recurring. That depends entirely on what your monitoring infrastructure captures.
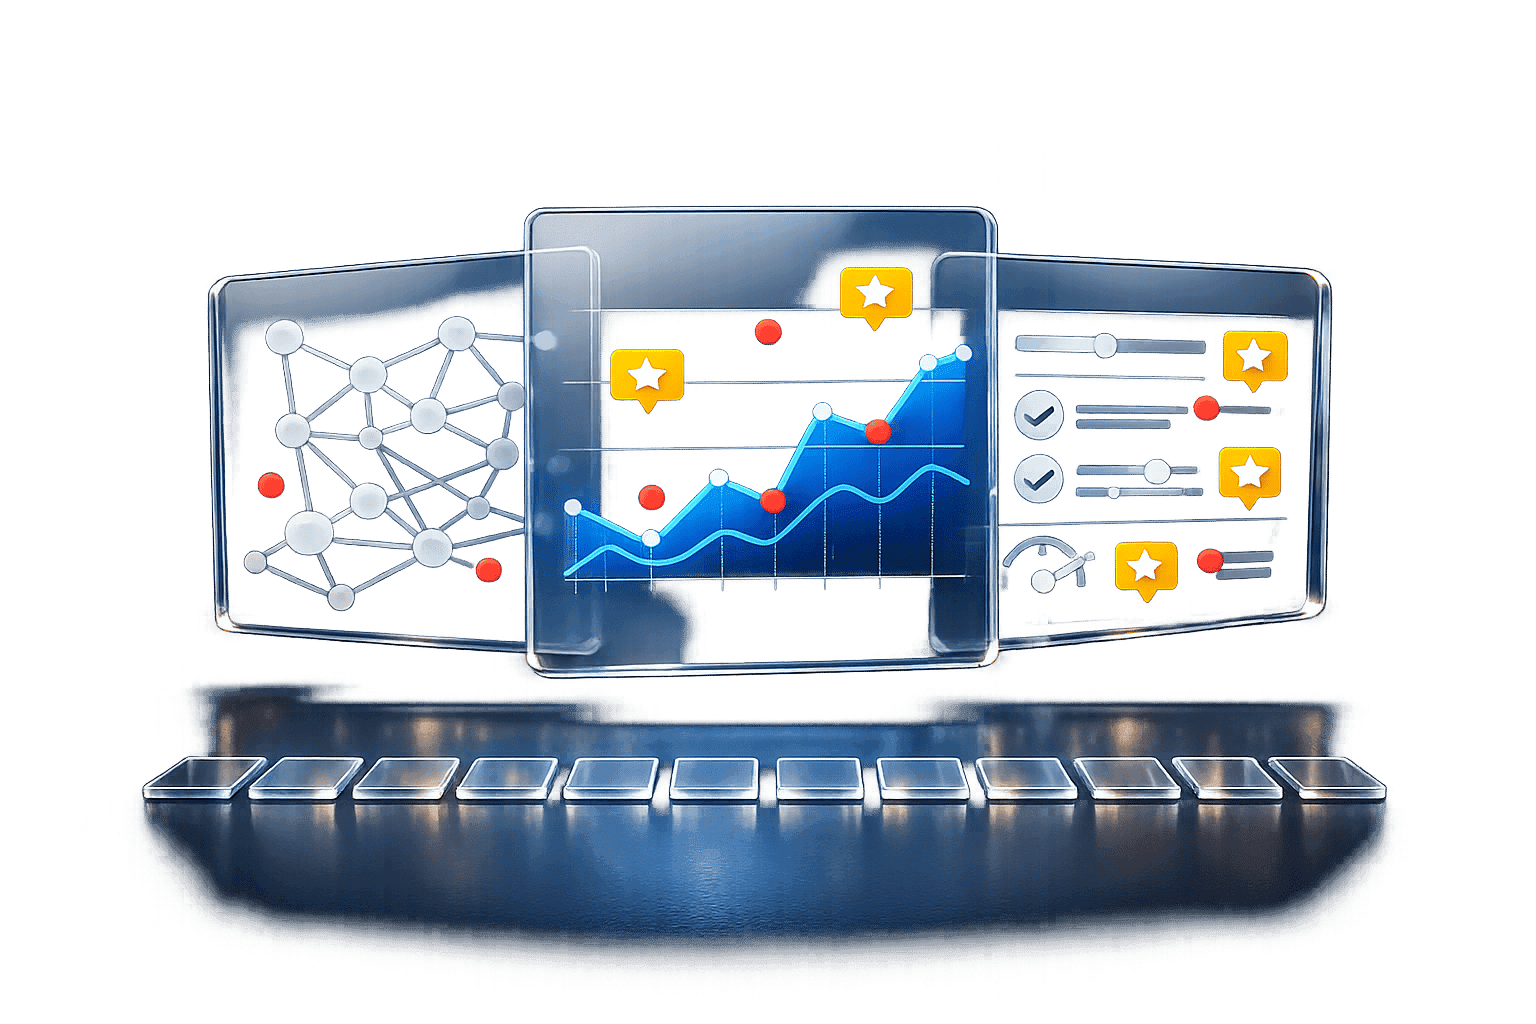
AI Agent Monitoring vs. Basic LLM Logging
Most teams start with basic LLM request logging: inputs, outputs, latency, token counts. This is valuable at the prototyping stage. It tells you what your model received, what it returned, and how long it took. For simple question-answering apps and summarization pipelines, it’s often sufficient.
AI agents are different. An agent doesn’t make one LLM call — it makes dozens, each informed by previous decisions. It calls tools, manages state across turns, coordinates with other agents, and pursues goals that can drift over a long session. When it fails, it rarely produces a clear error. It produces a response that completes successfully but gives the wrong answer, takes the wrong action, or serves a subtly different goal than what the user intended.
Basic LLM logging misses the failure modes that matter most for agents:
-
A tool called with the wrong arguments at step 3 that silently corrupts steps 4 through 9
-
Context loss at turn 8 of a 12-turn conversation because constraints from turn 1 were evicted from the context window
-
A reasoning loop where the agent retries the same failed approach 7 times before timing out
-
Gradual quality degradation over a week following a prompt change that didn’t register on any error metric
According to research on LLM agent benchmarks, agents evaluated only on final-output quality pass 20–40% more test cases than full trajectory evaluation reveals (Wei et al., 2023). That gap represents production failures that only trace-level monitoring can catch.
This guide compares ten platforms for monitoring multi-turn AI agents in production, evaluates them against the criteria that matter for this specific use case, and gives you a decision framework for choosing the right tool.
6 Criteria for Evaluating Agent Monitoring Platforms
1. Agent-Specific Capabilities
Does the platform capture multi-turn conversation state, tool call sequences, and agent decision chains as first-class objects — or does it log individual LLM calls independently? This architectural decision determines whether you can query “why did the agent fail at step 6” or only “what did the model return at step 6.”
2. Issue Discovery
Does the platform automatically detect and cluster failure patterns from production traces, or does it present raw logs and leave pattern identification to you? At any meaningful production volume, manual log analysis doesn’t scale. Automated failure clustering — grouping related incidents by root cause signature — is what separates monitoring tools from observability platforms.
3. Evaluation Integration
Does the platform connect production observability to testing and evaluation? The highest-value loop in AI agent development is: production failure detected → converted to test case → regression prevented in next deployment. Platforms that support this loop reduce the cost of shipping quality improvements.
4. Deployment Model
Cloud-hosted, self-hosted, or both? Teams with data residency requirements, privacy constraints, or existing security policies often need self-hosted options. The right answer depends on your compliance requirements, not just feature preference.
5. Pricing Transparency
Is pricing based on traces, seats, or usage volume? At production scale, pricing opacity translates directly into budget uncertainty. Evaluate pricing structures against your actual interaction volume before committing.
6. Integration Ecosystem
Which orchestration frameworks, model providers, and deployment environments does the platform support? Some platforms instrument LangChain with a single environment variable; others require custom SDK integration for each framework. Evaluate for your specific stack.
Platform Comparison: 10 AI Agent Monitoring Tools
| Platform | Agent-Native | Issue Clustering | Eval Integration | Self-Hosted | Starting Price |
|---|---|---|---|---|---|
| Latitude | Yes — causal traces | Automatic (Signals + Behaviours) | Auto-gen + closed loop (issue → PR via MCP) | Available (MIT) | Free (20K credits/mo); $99/mo Pro |
| Langfuse | Partial — nested spans | Manual | Manual | Yes (OSS) | Free (self-hosted); $29/mo cloud |
| LangSmith | LangChain only | Manual | Dataset-driven | No | Free (5K traces/mo); $39/seat/mo |
| Braintrust | Partial — eval-first | Manual | Strong — CI/CD gating | No | Free (1M spans/mo); $249/mo Pro |
| Helicone | No — API calls only | No | No | No | Free tier; usage-based |
| Datadog LLM Obs. | Partial — add-on | Alert-based | No | No | Add-on to Datadog pricing |
| MLflow | Partial — recent addition | Manual | Experiment tracking | Yes (OSS) | Free (OSS); Databricks enterprise |
| LangWatch | Partial — simulation focus | Limited | Simulation-based | Yes (OSS) | Free (OSS); cloud plans available |
| Arize AI | Partial — ML-heritage | Drift detection | Limited | Yes (Phoenix OSS) | Free (25K spans/mo); $50/mo+ |
| Portkey | No — gateway focus | No | No | Yes (OSS gateway) | Free OSS; managed cloud available |
Latitude
Best for: Production multi-turn agents with complex tool use
Latitude is an agent-first, open-source (MIT) observability and evaluation platform built specifically for multi-turn, tool-using agents in production, and organized as a loop — Observe → Understand → Refine — rather than a dashboard. Its sharpest differentiator is closing that loop from issue → opened PR: its MCP server connects your coding agent (Claude Code, Cursor, and similar) directly to your workspace, so a detected issue can move toward a fix and an opened PR from inside the agent rather than staying an alert you act on manually. The MCP-to-coding-agent connection is real today; the direction is to make reliability work actually close instead of stopping at the observability layer. Underneath, it models agent execution as a causal trace of dependent steps, with Behaviours clustering sessions by meaning and Signals turning recurring failures into named, tracked problems with a full lifecycle (first observation → verified resolution). Evals auto-generate from those Signals; GEPA and MCC-based scoring are supported for teams that want them, as supporting details rather than the core pitch.
Strengths: Closed loop from issue → opened PR via the MCP server that connects your coding agent; agent-native causal trace architecture; Behaviours (intelligence layer) + Signals with automatic clustering; evals auto-generated from real failures; multi-turn simulation for pre-deployment testing; open source (MIT), self-hostable
Limitations: Newer platform with smaller ecosystem than LangChain-native tools; the intelligence layer works best with a structured annotation workflow
Pricing: Free Starter (20K credits/mo, 30-day retention, unlimited seats); $99/mo Pro (100K credits/mo, 90-day retention, unlimited seats, SOC 2 & ISO 27001, extra credits $20/10K); custom Enterprise. Metered in credits; self-hosting free and MIT-licensed. Try free.
Langfuse
Best for: Self-hosted LLM observability
The most widely adopted open-source LLM observability platform, with over 9,000 GitHub stars and an active community. Provides LLM call logging, prompt management, dataset creation, and nested trace support for multi-step workflows. MIT-licensed and self-hostable — the natural choice for teams with data residency requirements. Multi-step agent traces are logged as nested spans, but causal relationships between steps require manual reconstruction. No automated issue clustering.
Strengths: MIT-licensed open source; self-hosting well-documented; widest framework integration; good prompt versioning
Limitations: LLM-first architecture; manual trace correlation for agent debugging; no issue clustering
Pricing: Open-source self-hosted free; cloud from $29/month; enterprise custom
LangSmith
Best for: LangChain and LangGraph teams
LangChain’s native observability platform. One environment variable and you have traces, session replay, and annotation workflows — the lowest-friction path to production observability for LangChain teams. The lock-in risk is the flip side of the integration advantage: migrating away from LangChain means rebuilding observability. Non-LangChain stacks require significant integration investment to reach comparable coverage.
Strengths: Near-zero setup for LangChain/LangGraph; mature eval framework; $39/seat/month accessible pricing
Limitations: Deep LangChain coupling creates framework lock-in; limited for custom agents
Pricing: Free (5K traces/month); Plus $39/seat/month; enterprise custom
Braintrust
Best for: Eval-driven development culture
Evaluation-first platform integrating production monitoring with testing workflows. Prompts are versioned objects; experiments run against structured datasets; production traces feed back into eval datasets. Generous free tier: 1M trace spans/month, unlimited users, 10K eval runs. Issue clustering is manual — pattern identification requires human analysis of trace data.
Strengths: Best eval experiment UI; generous free tier; CI/CD-integrated regression gating; strong prompt versioning
Limitations: Evaluation-first design means production tracing UX less polished; issue clustering is manual
Pricing: Free (1M spans/month, unlimited users); Pro $249/month; enterprise custom
Helicone
Best for: Prototyping and cost visibility
Lightweight proxy-based monitoring. One endpoint change gets you cost tracking and request logs for all LLM API calls. Fastest time-to-observability of any tool in this list. Its proxy architecture captures API calls, not agent execution — no multi-step trace support, no causal relationships, no evaluation capabilities.
Strengths: One-line integration; meaningful cost reduction through caching; fastest setup
Limitations: No agent execution traces; no evaluation; captures API calls only
Pricing: Free tier; usage-based paid plans
Datadog LLM Observability
Best for: Teams already running Datadog for infrastructure
Extends Datadog’s enterprise infrastructure monitoring into LLM applications. For teams already on Datadog, it provides LLM monitoring without adding a new vendor — unified alerting, existing access controls, one dashboard for infrastructure and LLM. LLM features are add-ons, not purpose-built for agent workflows — agent-specific capabilities are limited. Datadog’s pricing model compounds at high LLM trace volumes.
Strengths: Unified infrastructure + LLM monitoring; enterprise alerting infrastructure; existing access controls
Limitations: Not purpose-built for agents; pricing compounds at volume; limited agent-specific features
Pricing: Usage-based add-on to existing Datadog plans; contact sales
MLflow
Best for: Teams embedded in the MLflow ecosystem
The most widely deployed open-source ML lifecycle platform. Has added LLM tracing to its experiment tracking and model registry workflow. Zero new tool adoption for teams already using MLflow. LLM tracing is a recent addition — not purpose-built for agent workflows; multi-turn agent debugging requires significant manual effort.
Strengths: Ubiquitous in enterprise ML environments; strong model versioning; zero adoption overhead for MLflow users
Limitations: Agent tracing not purpose-built; manual debugging effort
Pricing: Open-source free; Databricks-managed at enterprise pricing
LangWatch
Best for: Pre-deployment multi-turn simulation
Open-source AI agent testing and LLM evaluation platform with over 2,500 GitHub stars. Provides LLM call tracing, multi-turn agent simulations using realistic conversation flows, quality evaluations, and prompt management. Its agent simulation capability — validating AI behavior using realistic multi-turn conversations before deployment — differentiates it from pure observability tools. Smaller ecosystem than Langfuse or LangSmith; production monitoring capabilities less mature.
Strengths: Multi-turn agent simulation for pre-deployment validation; open-source with self-hosting
Limitations: Smaller community than established platforms; production monitoring less mature
Pricing: Open-source free; cloud plans available
Arize AI
Best for: Enterprise ML teams with compliance requirements
Enterprise ML observability platform extended into LLM and agent monitoring. Strong access controls, compliance features (SOC2, HIPAA-ready), and integration with existing ML infrastructure. Phoenix (open-source, OTel-native, free) provides a self-hosted entry point. ML monitoring heritage means less emphasis on multi-step agent trace causality debugging.
Strengths: Enterprise security and compliance; strong drift detection; Phoenix OSS option; best RAG eval depth
Limitations: Less emphasis on agent trace causality; enterprise pricing opaque
Pricing: Free tier (25K spans/month); $50/month+; enterprise custom. Phoenix fully open-source free.
Portkey
Best for: Multi-provider LLM routing with observability included
AI gateway and observability platform routing requests across 250+ LLM providers while logging every call. Actively manages requests: caching, fallbacks to backup providers when primary providers fail, rate limits, unified provider access. Processes 25M+ daily requests with 99.99% uptime; ISO 27001 and SOC 2 certified. Gateway-first architecture means observability at API call level — multi-step agent workflow debugging is limited. Not an evaluation platform.
Strengths: Gateway + observability in one layer; enterprise reliability (25M+ daily requests); provider redundancy
Limitations: API call-level observability only; no agent trace analysis; no eval capabilities
Pricing: Free open-source gateway; managed cloud plans available
How to Choose: A Decision Framework
| If your situation is… | Best choice | Key reason |
|---|---|---|
| Production multi-turn agents with complex tool use | Latitude | Agent-native causal traces; automatic clustering (Behaviours + Signals); closed loop from issue → PR via the MCP server that connects your coding agent |
| LangChain/LangGraph stack | LangSmith | Zero-config native tracing; zero integration overhead |
| Self-hosted / data residency / budget-constrained | Langfuse | MIT license; widest framework coverage; free self-hosted |
| Eval-driven development as primary workflow | Braintrust | Best eval experiment UI; 1M spans/month free; CI/CD gating |
| Prototyping; need fast cost visibility | Helicone | One-line integration; fastest time-to-observability |
| Already running Datadog at scale | Datadog LLM Obs. | Unified infrastructure + LLM monitoring; no new vendor |
| Enterprise ML infrastructure / compliance | Arize AI | SOC2/HIPAA-ready; strong ML monitoring heritage; Phoenix OSS option |
| Multi-provider routing with built-in observability | Portkey | Gateway + fallbacks + observability in one layer; 99.99% uptime |
Implementation Checklist: Getting Production Monitoring Right
-
Define what “failure” means for your specific agent — Task completion rate, tool argument correctness, context constraint retention. Generic quality metrics won’t catch agent-specific failures.
-
Instrument production traces at the step level — Every tool call, LLM call, and state transition as a span with session ID linking all steps. Without step-level traces, you’re debugging final outputs without visibility into what produced them.
-
Set up issue clustering to surface patterns — Whether built into your platform (Latitude) or custom-built, pattern identification over raw traces converts observability data into actionable issues.
-
Connect production learnings to your eval pipeline — Every diagnosed production failure should generate at least one eval case added to pre-deployment testing. This is what makes the monitoring investment compound over time.
-
Define monitoring cadence and escalation paths — Set alerts on quality metrics (not just error rates); define who owns each alert type; establish escalation paths before you need them.
Frequently Asked Questions
What is the best AI agent monitoring tool for production in 2026?
Latitude is the best AI agent monitoring tool for production teams with multi-turn agents and complex tool use. It models agent execution as a causal trace, automatically clusters related failures into Signals, generates regression tests from those failures, and — uniquely — closes the loop from issue → opened PR by connecting your coding agent (Claude Code, Cursor, and similar) via its MCP server, so a detected issue can be driven toward a fix rather than staying an alert. For LangChain/LangGraph teams, LangSmith provides zero-config tracing. For self-hosted deployment, Langfuse is the leading open-source option.
What is the difference between AI agent monitoring and LLM logging?
Basic LLM logging captures individual API calls: inputs, outputs, latency, and token counts. AI agent monitoring captures the causal chain of a full agent execution: tool call sequences, state transitions across turns, context management, and step-level dependencies. Most production agent failures are invisible to LLM call logging and only detectable through step-level trace analysis.
How much does AI agent monitoring cost at production scale?
Free options include Langfuse (self-hosted), LangWatch (open-source), MLflow (open-source), and Phoenix/Arize (open-source). LangSmith’s Plus plan costs $39/seat/month. Braintrust’s Pro plan is $249/month with 1M trace spans free. Latitude has a free Starter plan (20K credits/month, 30-day retention, unlimited seats) and is also free to self-host under the MIT license; its Pro plan is $99/month (100K credits/month, 90-day retention). Datadog and enterprise platforms require custom pricing.
Which AI agent monitoring tool works without LangChain?
Latitude, Langfuse, Braintrust, Arize Phoenix, and Helicone all support framework-agnostic instrumentation. LangSmith is the notable exception — its strongest capabilities are deeply coupled to the LangChain ecosystem and require significant integration effort for non-LangChain stacks. Latitude also ingests standard OpenTelemetry (OTEL) traces, so you can point an existing OTel pipeline at it with little or no code change.
Can Latitude fix issues automatically, not just find them?
Closing the loop from issue → opened PR is Latitude’s sharpest differentiator. Its MCP server connects your coding agent (Claude Code, Cursor, and similar) directly to your workspace, so a detected issue can move toward a fix and an opened PR from inside the agent rather than staying an alert you triage manually. The MCP-to-coding-agent connection is real today; the direction is to make reliability work actually close instead of stopping at the observability layer. The other tools in this guide surface and cluster failures, but writing the fix and opening the PR stays manual and outside the platform.