
Capture a lightweight envelope for every LLM trace when cost and governance allow it. Then choose payload retention, deterministic checks, semantic evaluation, and human review separately. One sampling percentage cannot make all of those decisions for you.
That distinction matters because teams often say “we sample 10%” while referring to different data. One team exports 10% of requests. Another captures every request but keeps full prompts for 10%. A third stores everything and runs an LLM judge on 10%. Those policies have different costs and failure modes.
What does “sample 10%” actually mean?
| Layer | Decision | What 10% means here | Main risk |
|---|---|---|---|
| Ingest capture | Whether a request gets a trace ID and envelope | Nine of ten requests leave no trace | A rare failure may become impossible to reconstruct |
| Payload fidelity | Whether prompts, responses, retrieved text, and tool payloads are stored | Every envelope exists, but only one in ten has full content | Diagnosis may lack the exact evidence |
| Retention | How long each field remains available | Full content moves to short retention or cold storage | An old regression may outlive its evidence |
| Deterministic analysis | Which eligible traces receive rules or schema checks | Only one in ten is checked | Cheap, known failures go undetected |
| Semantic evaluation | Which traces receive an LLM judge or classifier | One in ten incurs model analysis | Quality estimates may miss small cohorts |
| Human review | Which traces a person reads | One in ten is manually labeled | Review capacity is spent on a weak sample |
The useful question is: 10% of which layer, selected how, and used to estimate what?
Should every request have a captured trace envelope?
For many LLM applications, yes. A compact envelope can preserve the request ID, session ID, timestamp, model and prompt version, release, user or tenant identifier, latency, token counts, tool names, error state, and content hashes. It does not require permanent storage of every raw prompt or tool result.
This gives you a denominator for rates and keeps incidents searchable. It also preserves session continuity, which matters when a failure appears only after several turns.
There are valid reasons to reduce ingest coverage. Extremely high traffic, oversized span graphs, hard data-residency limits, or a telemetry pipeline that cannot absorb peak load may force sampling. Make that choice after measuring the loss. OpenTelemetry’s sampling guidance explicitly includes the opportunity cost of missing critical information alongside storage and compute cost.1
How do head, tail, and adaptive sampling differ?
OpenTelemetry defines head sampling as a decision made near the start of a trace, before the complete outcome is known. Tail sampling waits until all or most spans are available, so the collector can retain traces with errors, high latency, or chosen attributes.1
| Method | Decision time | Strength | Weakness | Good fit |
|---|---|---|---|---|
| Probability head sampling | At trace start | Cheap, consistent, simple | Cannot know whether the trace will fail | Homogeneous, high-volume traffic and stable baseline estimates |
| Rule-based tail sampling | After most spans finish | Can keep known errors, slow traces, or new releases | Stateful buffering and more collector complexity | Production systems with recognizable technical failure criteria |
| Adaptive or targeted selection | Changes by cohort, event, or risk | Spends coverage on releases, incidents, VIP tenants, or negative feedback | Produces a biased sample unless inclusion probabilities are tracked | Expensive payload capture and semantic evaluation |
| Full envelope capture | Every request | Exact denominators and complete discovery surface | Higher ingest and indexing cost | Low-to-moderate volume or heterogeneous agent traffic |
Tail sampling has operational costs. The collector buffers spans while it waits, must route the same trace to the same decision point, and can produce fragmented traces when spans arrive after the decision window. The OpenTelemetry project describes tail sampling as stateful and difficult to operate at large scale.1
A documented OpenTelemetry example retains every trace with an ERROR status and a random 25% of the rest.2 The percentage is illustrative. The important design is the combination of targeted retention and a probability baseline.
When is 10% enough?
Ten percent can be enough for estimating a common, stable outcome in a large and reasonably homogeneous population. It is weak protection against rare failures, small tenant cohorts, release-specific regressions, and long multi-turn sessions.
OpenTelemetry notes that 1% or less may represent very high-volume systems when healthy traffic dominates and variation is low.1 LLM traffic often violates those assumptions. Inputs are open-ended, tool paths differ, and a technically successful request can still be wrong. Validate representativeness for your own traffic before using a percentage as policy.
Use this checklist:
- What population will the sample represent: requests, sessions, users, or tool calls?
- Is selection probability known for every retained item?
- Is the metric common enough to appear reliably at this sample size?
- Could one release, customer, language, or workflow have a different failure rate?
- Will complete sessions remain intact?
- Can an incident switch the system to broader capture immediately?
How do targeted samples and a random baseline work together?
Targeted selection finds known high-value cases. Keep all crashes, tool errors, negative feedback, guardrail failures, traces from a new release, and sessions from a monitored account. This is useful for diagnosis, but it inflates the apparent failure rate.
A stable probability sample gives you an unbiased baseline when inclusion probabilities are known. Keep it alongside targeted cases. Report the two streams separately, or apply appropriate weights before estimating population counts and rates.
OpenTelemetry’s tail-sampling guidance warns that a backend cannot recover accurate total counts or percentiles from a biased sample unless it receives enough sampling metadata to reweight the data.2 A dashboard built only from retained failures describes the retained set. It does not describe all production traffic.
Unknown failures are another reason to keep a baseline. A rule that retains only errors cannot catch a polite false-success response if no rule recognizes it yet.
How should sampling change by operating condition?
| Condition | Envelope | Full payload | Deterministic checks | Semantic evaluation |
|---|---|---|---|---|
| Development and staging | 100% | Broad, after secret scrubbing | 100% eligible | High coverage while volume is low |
| Stable low-volume production | 100% | Broad with field controls | 100% eligible | Random baseline plus targeted cases |
| High-volume production | Prefer 100%; measure pipeline limits | Tier by cohort and diagnostic value | 100% where cheap | Lower random baseline plus targeted cases |
| New release | 100% | Increase temporarily | 100% eligible | Increase for exposed cohorts |
| Active incident | 100% if the pipeline is safe | Increase around affected paths | 100% eligible | Target affected traffic and preserve a baseline |
| Sensitive or regulated workflow | Metadata envelope with allowlisted fields | Redacted, tokenized, or disabled by field | Run checks on minimized data where possible | Use approved fields and shorter retention |
| Large RAG or tool payloads | 100% envelope with content hashes and sizes | Selective chunks or external references | Validate schemas and tool outcomes broadly | Evaluate representative and high-risk sessions |
How do you estimate storage and evaluation cost?
Use measured bytes and tokens from your own traces.
storage bytes = requests/day × retention days
              × (envelope bytes + full-payload share × incremental payload bytes)

evaluation cost = requests/day × evaluation share
                × evaluator tokens/trace × price/token
Here is a hypothetical sizing exercise. One million requests per day, a 2 KB envelope, 20 KB of incremental full payload, 10% full-payload retention, and 30 days of retention produce about 120 GB before indexes, compression, and replicas.
1,000,000 × 30 × (2 KB + 0.10 × 20 KB) = 120,000,000 KBIf an LLM evaluation consumes 2,000 tokens per selected trace, 1% coverage processes 20 million tokens per day. At 10%, it processes 200 million. Multiply those token totals by the current price of your chosen judge model. Do the same calculation for retries and any second-pass review.
The calculation usually shows why ingest capture and LLM evaluation need separate policies.
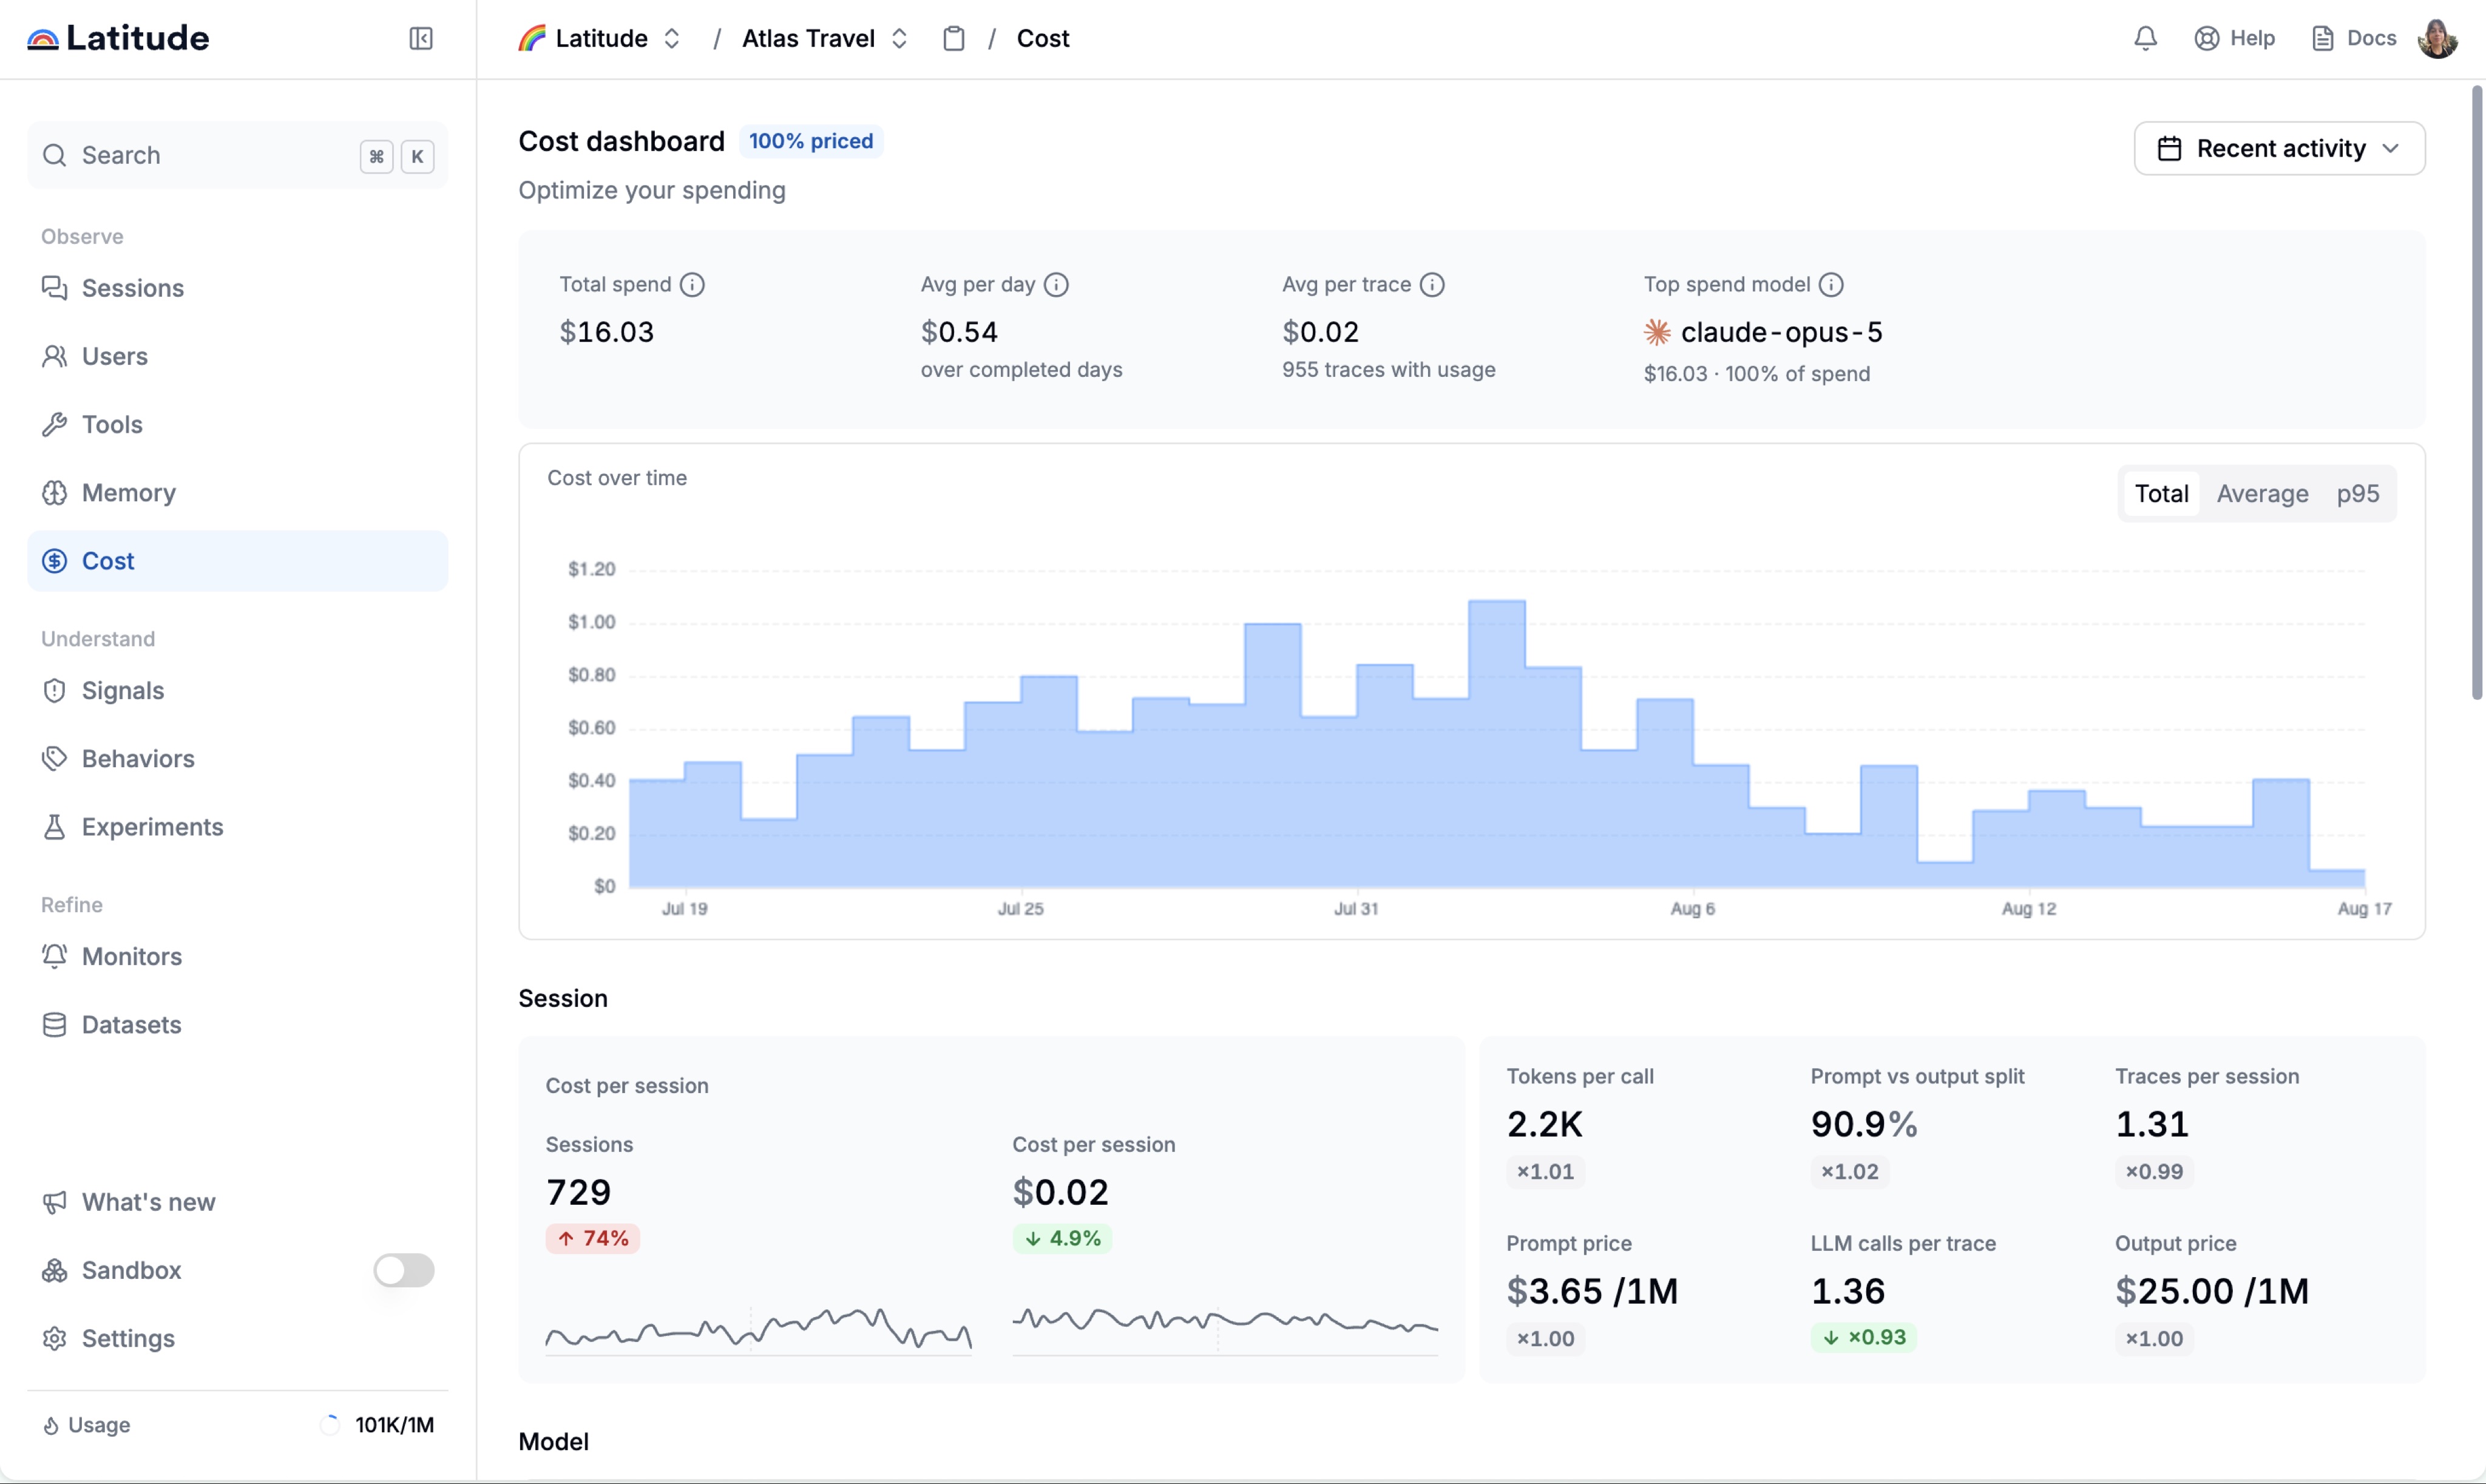
In this Atlas Travel example, 955 priced traces produced $16.03 in model spend, or $0.02 per trace on average, over the selected recent-activity window. These are project-specific figures, shown as an example rather than a general cost benchmark.
How should privacy change the policy?
Trace coverage does not require unrestricted raw-content retention. The UK Information Commissioner’s Office says personal data should be adequate, relevant, and limited to what the stated purpose requires.3 Its storage-limitation guidance requires organizations to justify retention periods and erase or anonymize data when it is no longer needed.4
Map each diagnostic purpose to a control:
| Purpose | Useful data | Control |
|---|---|---|
| Count requests and failures | IDs, timestamps, versions, status, hashes | Keep a compact envelope |
| Debug a tool integration | Tool name, schema, sanitized arguments, outcome | Allowlist fields and redact secrets |
| Review conversation quality | Selected prompt and response content | Restrict access and use shorter retention |
| Track one user journey | Stable pseudonymous user and session IDs | Separate identity mapping and limit access |
| Reproduce a regulated decision | Approved evidence set and audit metadata | Apply domain-specific retention and legal review |
Avoid collecting raw content “just in case.” Write down the purpose of each field, who can access it, its retention period, and how deletion propagates through hot storage, archives, and indexes.
How does Latitude separate capture from analysis?
Latitude uses a layered policy:
- It captures 100% of traces on ingest.
- Semantic search runs across captured traffic.
- Deterministic flaggers run across 100% of eligible traces.
- LLM-based flaggers use a 10% default sample, configurable up to 100%, because model analysis consumes credits.
Gerard, an engineer on Latitude’s search work, summarized the capture side as “100% of traffic, no sampling.” The phrase applies to ingest and search coverage. It does not mean that every trace receives an LLM judgment.
This split preserves the discovery surface and exact denominators while controlling the expensive analysis layer. It also keeps the tradeoff visible. Increasing LLM-flagger coverage buys more analyzed traffic and costs more. A deterministic tool-schema failure can be checked broadly without paying for a model call.
Once a recurring failure is identified, Latitude groups it into a Signal with example traces and a trend. Teams can turn representative failures into regression coverage, then watch the Signal after a fix. That workflow depends on retaining enough evidence to understand the problem before selecting examples for deeper analysis. See how monitoring and evals fit together and how to track recurring LLM failures.
What policy should a small team start with?
Start with full envelopes, aggressive secret scrubbing, 100% cheap checks, and two semantic-evaluation streams. One stream is a stable random sample. The other retains targeted cases such as negative feedback, new releases, and known high-risk paths.
Measure envelope size, payload size, ingestion overhead, and evaluator tokens for one week. Then set retention and semantic-evaluation coverage from those measurements. Add an incident mode that temporarily increases capture around the affected path without changing the permanent policy for all traffic.
FAQ
Is 100% trace capture always the right choice?
No. It is a strong default for lightweight envelopes when traffic is manageable and governance permits it. High volume, oversized traces, regulation, or pipeline limits can justify lower ingest coverage. Quantify the diagnostic loss before dropping requests.
Does 100% capture mean storing every prompt forever?
No. Capture, payload fidelity, and retention are separate controls. You can keep an envelope for every request while redacting fields and retaining selected raw content for a shorter period.
Is 10% LLM-as-a-judge coverage enough?
It depends on event frequency, traffic volume, cohort size, and the estimate you need. Keep a probability sample for population estimates and add targeted cases for diagnosis. Validate the sample against human labels.
Does tail sampling catch unknown failures?
Only when a policy or retained random baseline includes them. A tail rule built around known errors cannot recognize a semantic failure that has no current signal.
Should deterministic checks be sampled?
Usually, broad coverage is preferable when the check is cheap and applies to the trace. Schema validation, empty responses, and explicit tool errors often cost little compared with an LLM judge.
What should happen during an incident?
Increase capture for the affected release, tenant, tool, or path; preserve complete sessions; shorten the decision loop; and keep a random baseline. Return to the normal policy after the incident and document the temporary change.
References
Footnotes
-
OpenTelemetry, Sampling, updated October 16, 2025. ↩ ↩2 ↩3 ↩4
-
Reese Lee, OpenTelemetry, Tail Sampling with OpenTelemetry, September 26, 2022. The page warns that older implementation details may have changed. ↩ ↩2
-
UK Information Commissioner’s Office, Principle (c): Data minimisation. ↩
-
UK Information Commissioner’s Office, Principle (e): Storage limitation. ↩