

Real-time observability is the process of monitoring and analyzing large language model (LLM) workflows in real-time to understand their behavior, performance, and outputs. It goes beyond traditional monitoring by focusing on why systems behave the way they do, offering insights into internal processes like reasoning and tool interactions. This is critical for managing the complexities of LLM workflows, which are non-deterministic and involve multiple stages.
Key Takeaways:
-
Why It Matters : Observability helps diagnose issues like hallucinations, latency bottlenecks, performance drift, and cost spikes.
-
Challenges : Common problems include inaccurate outputs, slow responses, and inefficient token usage - all of which can increase costs or degrade user experience.
-
Metrics to Track :
-
Performance : Latency (p50, p95, p99), throughput (RPM/RPH)
-
Resource Usage : Token consumption, cost-per-request
-
Quality : Accuracy, hallucination rate, relevance
-
Safety : Bias, toxicity, prompt injections
-
-
Debugging Tools : Visual tracing breaks down workflows into steps (e.g., prompts, model calls, tool interactions) to pinpoint bottlenecks.
-
Automation : Alerts and automated responses help handle latency spikes, token overuse, and quality drift without manual intervention.
Real-time observability ensures LLM workflows are efficient, cost-effective, and reliable by providing transparency across the entire process.
Key Metrics for Monitoring LLM Workflows
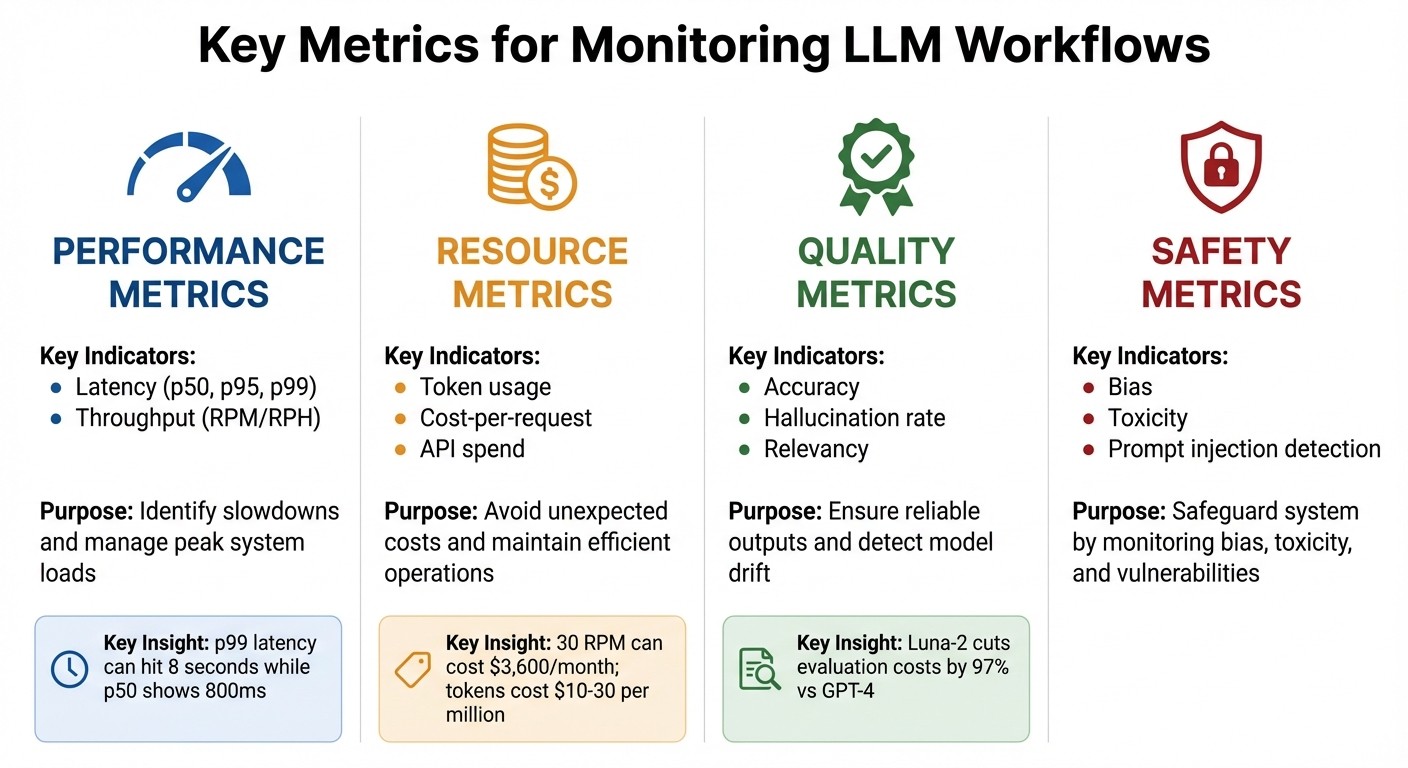
Key Metrics for Monitoring LLM Workflows: Performance, Resource, Quality, and Safety Indicators
Keeping tabs on the right metrics is what separates well-prepared teams from those constantly scrambling to fix issues. It’s not about how much data you collect - it’s about focusing on the metrics that matter. These metrics fall into three main categories: performance , resource consumption , and quality. Together, they help you diagnose performance problems, manage costs, and ensure your workflow delivers the results you need.
| Metric Category | Key Indicators | Purpose |
|---|---|---|
| Performance | Latency (p50, p95, p99), Throughput (RPM/RPH) | Identify slowdowns and manage peak system loads |
| Resource | Token usage, Cost-per-request, API spend | Avoid unexpected costs and maintain efficient operations |
| Quality | Accuracy, Hallucination rate, Relevancy | Ensure reliable outputs and detect model drift |
| Safety | Bias, Toxicity, Prompt injection detection | Safeguard your system by monitoring bias, toxicity, and vulnerabilities |
Performance Metrics: Latency and Throughput
Average latency doesn’t tell the full story. For example, a p50 latency of 800ms might look fine, but if your p99 latency hits 8 seconds, some users - likely the ones you care about most - are left frustrated. That’s why p95 and p99 percentiles are critical. They highlight the outliers, giving you a clearer picture of real-world performance.
Throughput, on the other hand, measures how many requests your system handles in a given time - requests per minute (RPM) or per hour (RPH). Even a modest workflow handling 30 requests per minute can rack up over $3,600 a month in inference costs if the prompts and outputs are large. By tracking throughput alongside latency, you can pinpoint whether slowdowns are due to system capacity or overly complex requests.
Resource Metrics: Token Usage and Cost
Tokens are money - literally. At rates of $10–30 per million tokens, inefficient prompts can drain budgets fast. That’s why it’s crucial to monitor token usage for both inputs and outputs, as well as cost-per-pass. This vigilance helps you catch costly scenarios early, like a misconfigured retry loop that repeatedly calls an expensive model. Once costs are under control, you can shift your focus to ensuring the outputs meet quality expectations.
Quality Metrics: Output Accuracy and Drift Detection
Once performance and resource metrics are in check, it’s time to focus on quality - because even a fast and cost-efficient system is useless if the outputs don’t meet user needs.
“LLM monitoring shows what happens; observability explains why.” – Nexos.ai
Quality metrics like accuracy , relevance , and coherence ensure your outputs are reliable. Accuracy measures how well outputs align with verified data, relevance checks if responses address user intent, and coherence ensures logical flow and grammatical correctness.
Performance drift is another challenge. Over time, models can behave differently due to API updates, changes in user queries, or updates to the underlying model. Real-time monitoring of metrics like hallucination rates and relevancy can help detect these shifts before they become user complaints. Tools like Luna-2 make this process affordable, cutting evaluation costs by up to 97% compared to premium APIs like GPT-4. This makes continuous quality checks not just possible but practical.
Debugging and Visual Tracing in LLM Workflows
Visualizing Workflow Execution
Visual tracing brings clarity to LLM workflows by mapping out the entire journey of each request. From gateway routing and prompt templating to model invocation and post-processing, every step gets recorded for easy review. This transparency is invaluable for understanding how your system operates.
“Because AI is inherently non-deterministic, debugging your application without any observability tool is more like guesswork.” – Langfuse
The process revolves around two key elements: traces and spans. A trace represents the full operation from start to finish, while spans break it down into smaller, time-stamped actions like tool calls, database queries, or LLM completions. These spans can nest within each other, showing dependencies and helping you zero in on problem areas - whether it’s a slow retrieval process or a tool call gone wrong. Each span also includes critical details like model settings (e.g., temperature, top_p), prompt versions, and system metadata. This rich context makes it easier to reproduce and fix inconsistent outputs. By visualizing these layers, you can quickly identify bottlenecks and failures.
Finding Bottlenecks and Failure Points
Different span types capture specific data to help isolate issues. For instance:
-
Prompt spans display the raw prompt and its template version, helping you determine if the problem lies in how the prompt is constructed.
-
Model spans log details like the model name, temperature, top_p, and token usage, making it easier to spot model-related issues or unexpected cost increases.
-
Tool spans track input arguments and execution times, which can reveal slow external API calls.
-
Retrieval spans show query results and similarity scores, aiding in diagnosing hallucinations caused by irrelevant context in retrieval-augmented generation (RAG) workflows.
In multi-turn applications, grouping traces into sessions using a session_id can help detect “conversation drift.” This happens when individual responses seem fine, but the overall dialogue starts to lose coherence. Visual dashboards allow you to dive into specific spans, helping you figure out whether delays or errors stem from model latency, prompt logic, or downstream transformations.
Debugging Real-Time LLM Issues
Debugging in real-time without disrupting ongoing processes is possible with asynchronous trace collection. SDKs send traces to collectors through distributed systems, ensuring that observability doesn’t add any latency to your application. For efficiency, you can use selective tracing with context managers to focus on specific requests, cutting down on unnecessary data collection.
Adding metadata like user_id, environment, or version to traces allows for more precise filtering. You can also configure tracers to exclude sensitive information (e.g., by setting traceIncludeSensitiveData: false) to maintain data security. In serverless environments like Cloudflare Workers, using forceFlush() in a finally block ensures that all debug data is exported before the worker shuts down.
Latitude’s playground offers a hands-on debugging space where you can test workflows and see the inputs and outputs at every step of a process. This tool lets you observe what each agent in a chain is doing, making it easier to catch errors in multi-agent workflows. Some platforms even feature AI-driven assistants that analyze trace data and suggest ways to optimize prompts or troubleshoot failures automatically.
Real-Time Alerting and Performance Drift Detection
Setting Up Real-Time Alerts
Real-time alerts rely on instrumentation , which involves using tools like OpenTelemetry or OpenLIT to gather metrics, events, logs, and traces from your large language model (LLM) applications. Monitoring metrics like p95 and p99 latency can help identify worst-case user experiences. It’s also important to set alerts for token usage spikes - a workflow running at 30 RPM can cost over $3,600 monthly if token consumption unexpectedly increases. Spending alerts are equally crucial to catch issues like “multi-planning loops”, where agents can get stuck and drain budgets.
Keep an eye out for silent failures such as infinite reasoning loops, stalled conversations, or broken tool integrations - problems that traditional logs may miss. As of 2025, 67% of organizations worldwide use LLMs in their operations, but many still lack the safeguards to prevent failures. A robust alerting system should trigger automated actions, such as blocking unsafe responses, switching to a backup model, or notifying engineers through tools like Slack or PagerDuty.
| Alert Category | Trigger Condition | Recommended Action |
|---|---|---|
| Latency Spike | p99 response time > 2 seconds | Scale resources and investigate retrieval bottlenecks |
| Token Overuse | 20% deviation from baseline cost | Audit prompt templates and check for loops |
| API Failure | Rate limit or timeout | Implement retry logic and switch to fallback provider |
| Quality Drift | Hallucination score > threshold | Revert to previous prompt version and adjust temperature |
Once you’ve set up alerts, focus on monitoring output quality to quickly identify and address performance drift.
Detecting and Responding to Performance Drift
To catch performance drift, compare real-time outputs against historical baselines or use “LLM-as-a-judge” evaluators to identify issues like hallucinations or factual inaccuracies. Advanced models can assess outputs for correctness, relevance, and accuracy.
“Monitoring sets the targets, observability uncovers why you miss them.” – Conor Bronsdon, Head of Developer Awareness, Galileo
Leverage distributed tracing to dive into specific spans of your workflow. This helps pinpoint whether the issue lies with the LLM itself, a retrieval problem in a retrieval-augmented generation (RAG) setup, or a tool-calling failure. Track metadata such as temperature, top_p, and model version within traces, as these factors significantly influence output consistency and costs. In RAG workflows, it’s also important to monitor the semantic similarity between user queries and retrieved documents - irrelevant results often lead to poor performance.
Using specialized small language models (SLMs) for quality checks can cut evaluation costs by up to 97% compared to relying on premium models like GPT-4. This approach avoids the expensive practice of “double-billing”, where one large LLM is used to evaluate another, making continuous monitoring more cost-effective.
When alerts signal a problem, automated responses can help resolve issues immediately.
Automating Alert Responses
Automating responses is key to reducing downtime. For API failures, implement retry logic and adjust rate limits as needed. If token or context-related errors occur, configure systems to modify prompts or reduce context size automatically when errors like “context length” or “invalid request” arise.
Set up real-time guardrails to block issues before they reach users. Automated policies can detect and prevent prompt injections, hallucinations, or inappropriate content. For infrastructure-related problems, configure auto-scaling to allocate more CPU or memory resources when demand spikes or crashes occur.
Version-controlled prompts are another valuable tool. If an alert pinpoints a specific prompt version as the cause of a performance issue, you can quickly roll back to a previous version. Additionally, incorporate high-quality production traces into regression datasets to keep test cases aligned with changing user behaviors. This creates a feedback loop, allowing your alerting system to adapt and improve continuously based on real-world patterns.
Implementing Real-Time Observability with Latitude
Latitude’s Observability Features
Latitude is an open-source platform tailored for AI and prompt engineering, offering observability tools designed to address the specific challenges of managing LLM workflows. With built-in telemetry, the platform automatically captures all interactions - inputs, outputs, metadata, and performance metrics - without requiring extra effort from users. Its AI Gateway acts as a proxy between your application and AI providers, managing prompt execution and logging seamlessly.
Latitude tracks key technical metrics, such as response latency (average, p95, p99), throughput (requests per minute or hour), and resource usage. It also monitors token consumption and costs on a per-request basis, breaking these down by specific features or teams to help you quickly identify spending spikes. Live Evaluations continuously analyze production logs, tracking quality metrics like safety and helpfulness as new data comes in. Engineers can dive into automatic spans and traces to pinpoint exactly where workflows encounter issues or bottlenecks, providing full visibility into agent reasoning steps.
“Latitude is amazing! It’s like a CMS for prompts and agents with versioning, publishing, rollback… the observability and evals are spot-on, plus you get logs, custom checks, even human-in-the-loop.” - Alfredo Artiles, CTO, Audiense
Building Monitoring Pipelines with Latitude
Latitude offers flexible integration options for building effective monitoring pipelines. You can either route prompt parameters through its AI Gateway for automatic logging or use the Python/TypeScript SDKs to manually submit logs while maintaining full observability.
To catch quality regressions in real time, you can activate Live Evaluation in the Evaluations tab. This feature continuously monitors production logs for key metrics, such as safety checks or helpfulness scores, as they are generated. Additionally, you can set up alerts for token consumption to identify which LLM features are driving costs, allowing you to optimize prompts as needed. With support for over 2,800 two-way integrations, Latitude enables you to connect monitoring data with tools like Slack or PagerDuty, ensuring automated notifications for critical updates.
“Tuning prompts used to be slow and full of trial-and-error… until we found Latitude. We test, compare, and improve variations in minutes with clear metrics and recommendations.” - Pablo Tonutti, Founder, JobWinner
These features make it easier to streamline monitoring and optimization, keeping your workflows efficient and cost-effective.
Team Collaboration in Latitude
Latitude goes beyond observability by fostering seamless team collaboration. Shared workspaces allow product managers, domain experts, and engineers to collaborate on agents, experiments, and results, with shared access to cost and performance metrics. The built-in version control system tracks changes and performance for each version, making it simple to compare different prompt versions and roll back to a previous one if necessary. Over 15,000 teams across various industries rely on Latitude to build and monitor AI agents, benefiting from its collaborative approach.
For real-time updates, the platform supports streaming via Server-Sent Events (SSE), providing transparency into the progress of complex chains, including tool execution and interactions with providers. This feature ensures that both technical and non-technical team members stay aligned on performance metrics and quality standards. For teams that need complete control, Latitude offers an open-source version that can be self-hosted for free, along with paid plans based on usage, integrations, and agent volume.
Best Practices for Real-Time Observability in LLM Workflows
Key Takeaways for Observability
Achieving real-time observability in LLM workflows goes beyond just monitoring the model itself. It involves keeping an eye on the entire application ecosystem. This includes tracking database queries, API timeouts during tool calls, vector searches, and background tasks to ensure smooth operations across the board.
To make observability effective, focus on tracking four key areas:
-
Metrics : Monitor latency, token usage, and costs.
-
Events : Keep track of API and tool calls.
-
Logs : Record user interactions for better insights.
-
Traces : Follow end-to-end execution paths for a complete picture.
Automating quality evaluations can significantly reduce the need for manual reviews, streamlining the process. Setting up alerts for issues like latency spikes, error rates, and token usage thresholds is crucial. These alerts help identify silent failures, such as unexpected retry spikes or rising costs, before they cause larger problems.
“Consistently, the most successful implementations use simple, composable patterns rather than complex frameworks.” - Anthropic Engineers
Structured logging is another essential practice. It allows you to capture prompts, responses, and metadata, such as template versions and API endpoints, for better analysis. Additionally, building regression test datasets from production traces can help detect LLM drift early, minimizing risks before updates are deployed. To manage costs efficiently, consider implementing caching and tiered model strategies.
These strategies naturally pave the way for practical implementation, which tools like Latitude can simplify.
Getting Started with Latitude
Latitude makes it easier to adopt these observability practices by offering tools designed with these principles in mind. As an open-source AI engineering platform, Latitude integrates features like telemetry, live evaluations, and collaborative workspaces to simplify implementation.
Teams can start by routing prompt parameters through an AI Gateway, which enables automatic logging. Activating live evaluations ensures continuous monitoring of quality. Collaborative workspaces provide unified access to performance and cost metrics, fostering teamwork and transparency. For organizations that need full control, Latitude offers a self-hosted, open-source option alongside usage-based paid plans, making it a flexible choice for teams of any size.
FAQs
What are the main benefits of using real-time observability in LLM workflows?
Real-time observability in large language model (LLM) workflows brings key benefits that directly impact reliability , cost management , and user safety. By keeping an eye on metrics like latency, token usage, accuracy, and costs, teams can quickly spot and fix issues - whether it’s a sudden performance dip or unexpected spending - before they affect users. Tools like alerts and live dashboards make it easier to troubleshoot problems such as hallucinations or sensitive data exposures, enabling swift action to avoid major errors in production.
On top of that, observability fuels ongoing improvements. By logging prompts, responses, and processing details, teams gain valuable data for better testing, expert evaluations, and model fine-tuning - all while sticking to safety guidelines. This same data can also inform cost-saving strategies, ensuring services stay on budget without sacrificing quality.
With its ability to combine early issue detection , cost oversight , and continuous refinement , real-time observability is indispensable for running production-grade LLMs smoothly and effectively.
How does visual tracing help identify and fix bottlenecks in LLM workflows?
Visual tracing turns the intricate steps of an LLM workflow into a clear, interactive timeline, making it much easier to identify delays. It tracks every component - like prompt preparation, retrieval, model inference, and post-processing - by providing detailed start and end timestamps, latency metrics, and even custom details such as token counts or API costs. This makes bottlenecks, such as a slow database query or an external API delay, stand out, so you can quickly pinpoint the problem.
By tying these traces to logs and error codes, visual tracing lets you connect latency spikes to specific failures, like timeouts or unexpected responses. This comprehensive visibility helps engineers zero in on issues, make targeted adjustments - such as optimizing retrieval indexes or batching requests - and verify improvements instantly. Plus, tools that integrate with OpenTelemetry can bring all this data together in a single dashboard, giving you a clear picture of performance, cost, and reliability across the entire LLM workflow.
What are the key metrics to monitor for optimizing LLM workflows and managing costs?
Monitoring the performance and cost of large language model (LLM) workflows involves keeping an eye on several important metrics :
-
Request volume : Helps you understand how often the system is being used and identify usage patterns.
-
Latency : Metrics like p50, p95, and p99 give insight into response times, showing how quickly the system processes requests.
-
Throughput : Measures the system’s capacity to handle tasks efficiently.
-
Error and timeout rates : Highlights potential problems that need attention.
-
Queue depth and model load balancing : Ensures tasks are distributed evenly and operations remain smooth.
-
Token usage and generation speed : Tracks input vs. output tokens and tokens-per-second to evaluate efficiency.
-
Cost per request or total cost : Provides a clear picture of expenses to help manage budgets effectively.
-
Token-level performance metrics : Includes details like time-to-first-token and time-per-output-token for a deeper understanding of processing performance.
Tracking these metrics helps maintain high performance, improve reliability, and keep costs under control in your LLM workflows.