
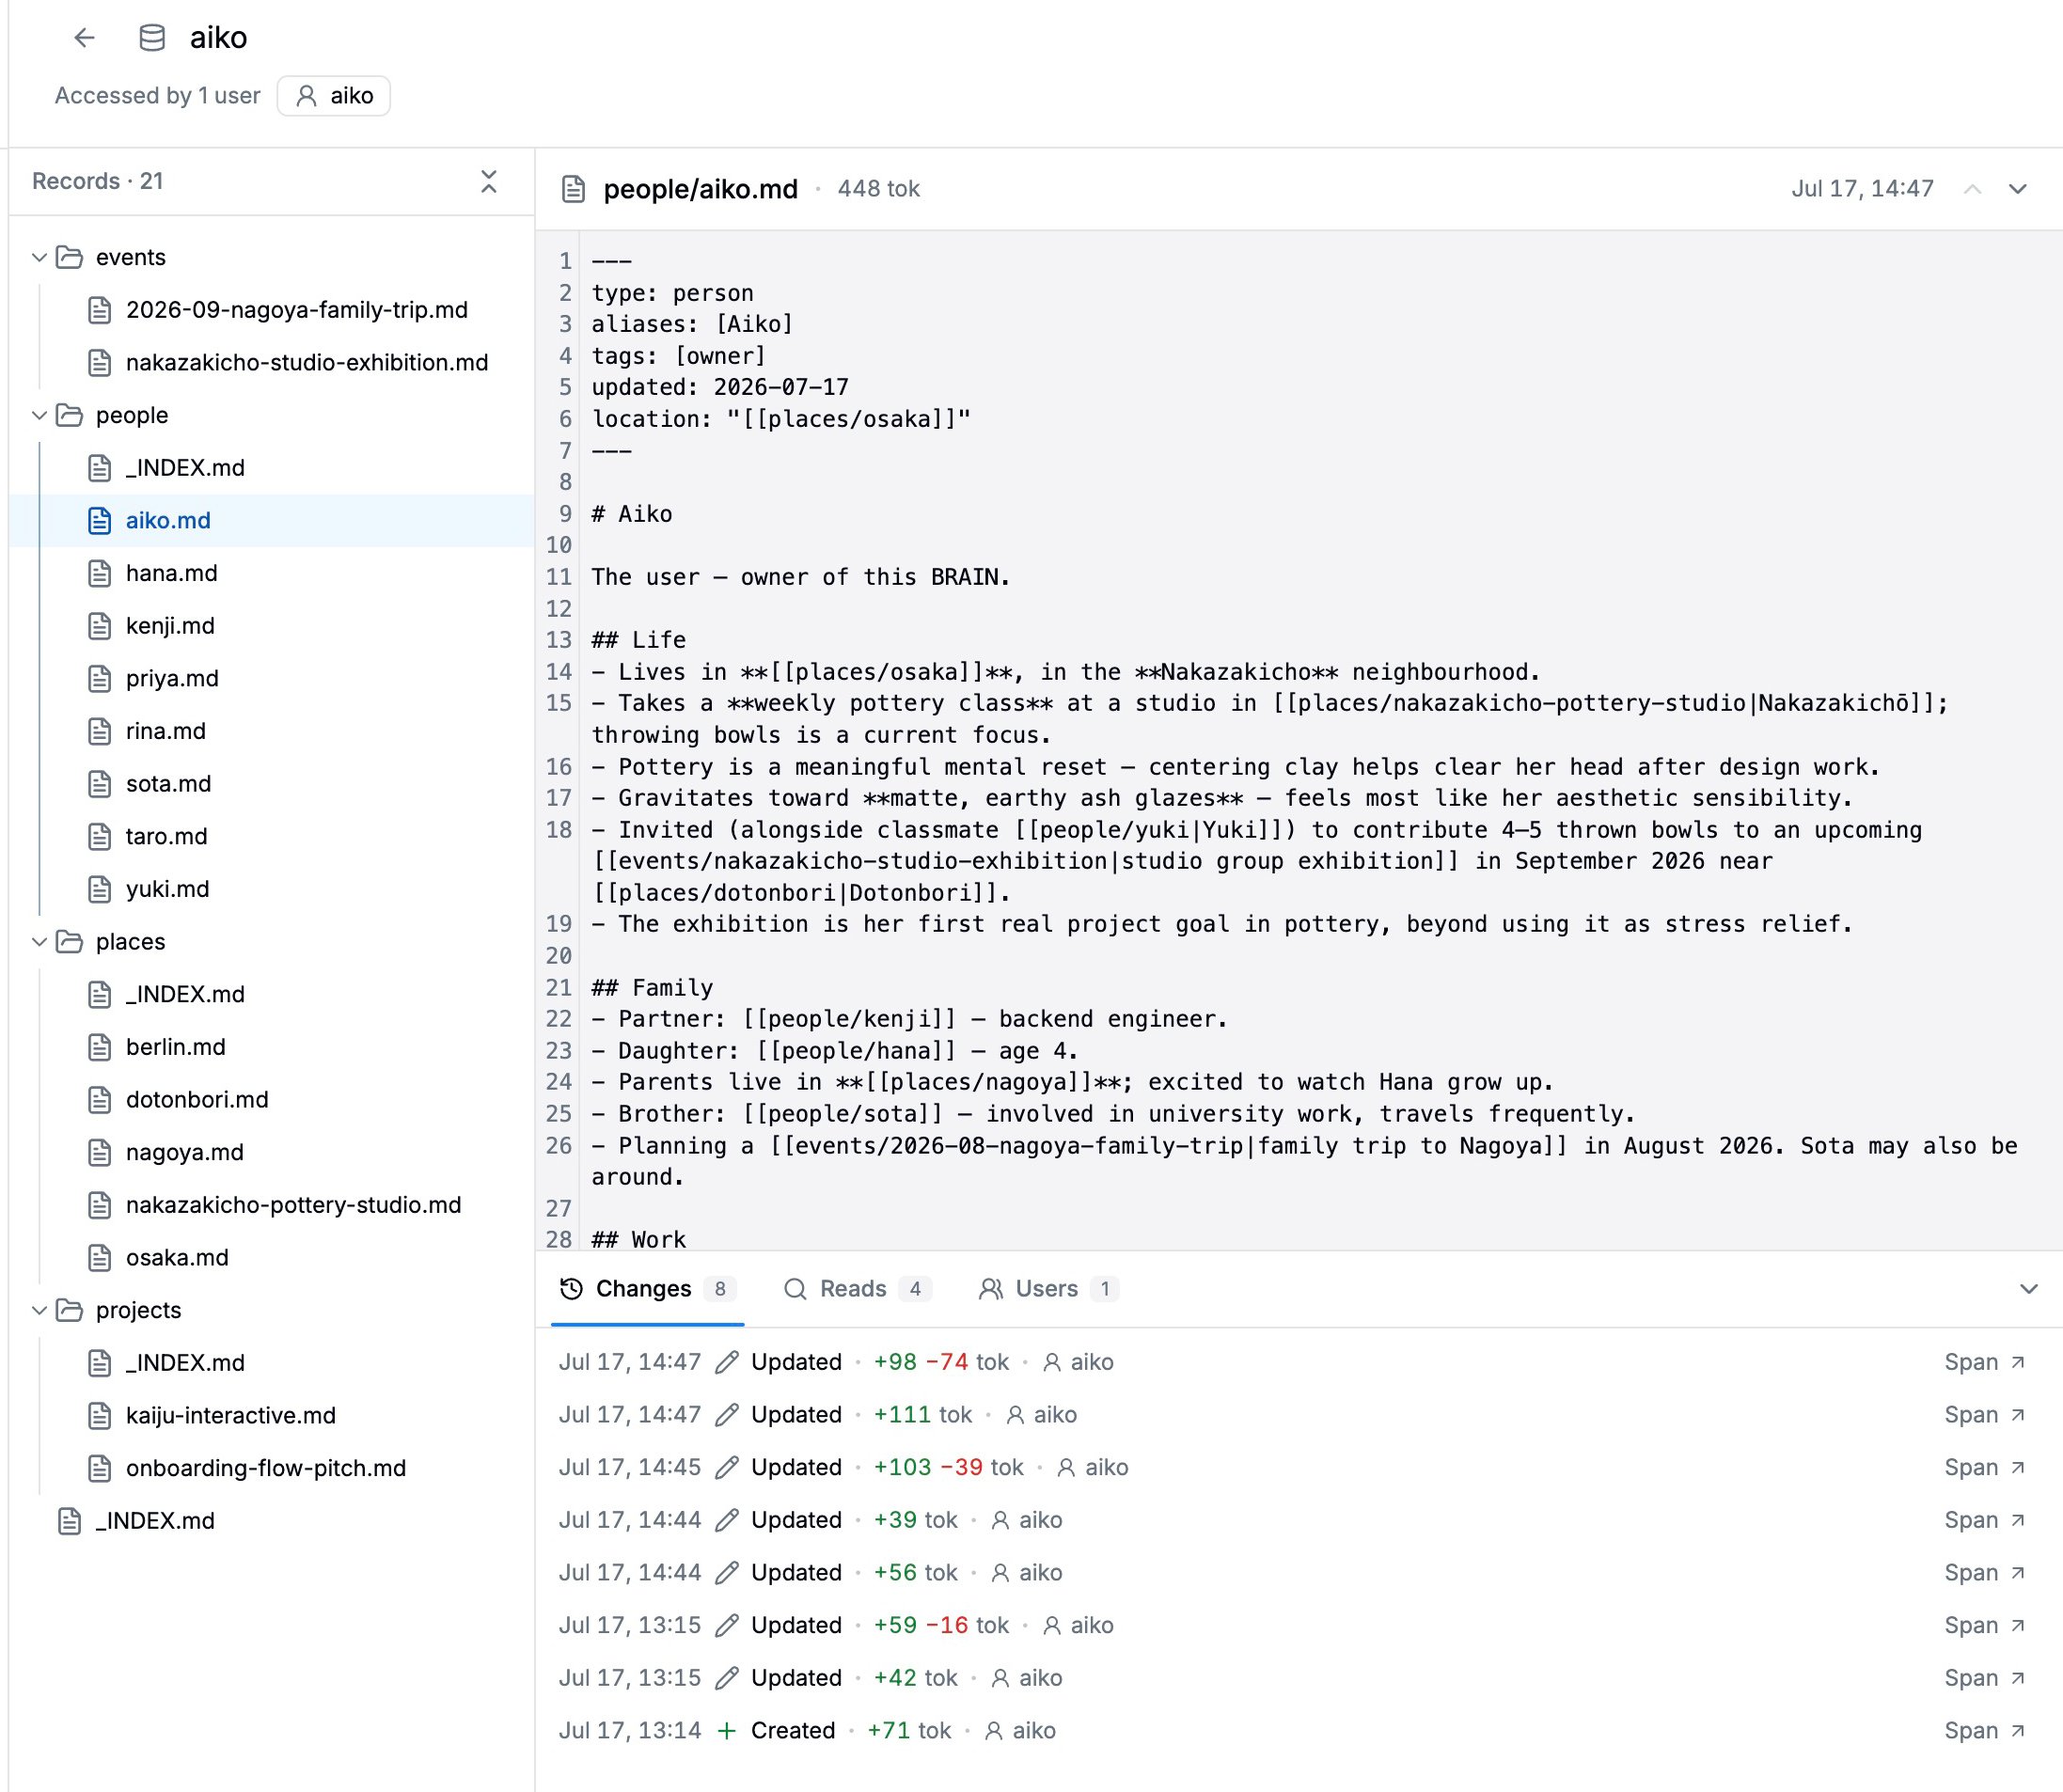
If your agents keep persistent memory, Latitude now records every memory operation they run and treats each write like a commit. The new Memory page shows the current contents of every store, the full history of each record, who read and wrote it, and a diff for every change — each one linked back to the session that caused it.
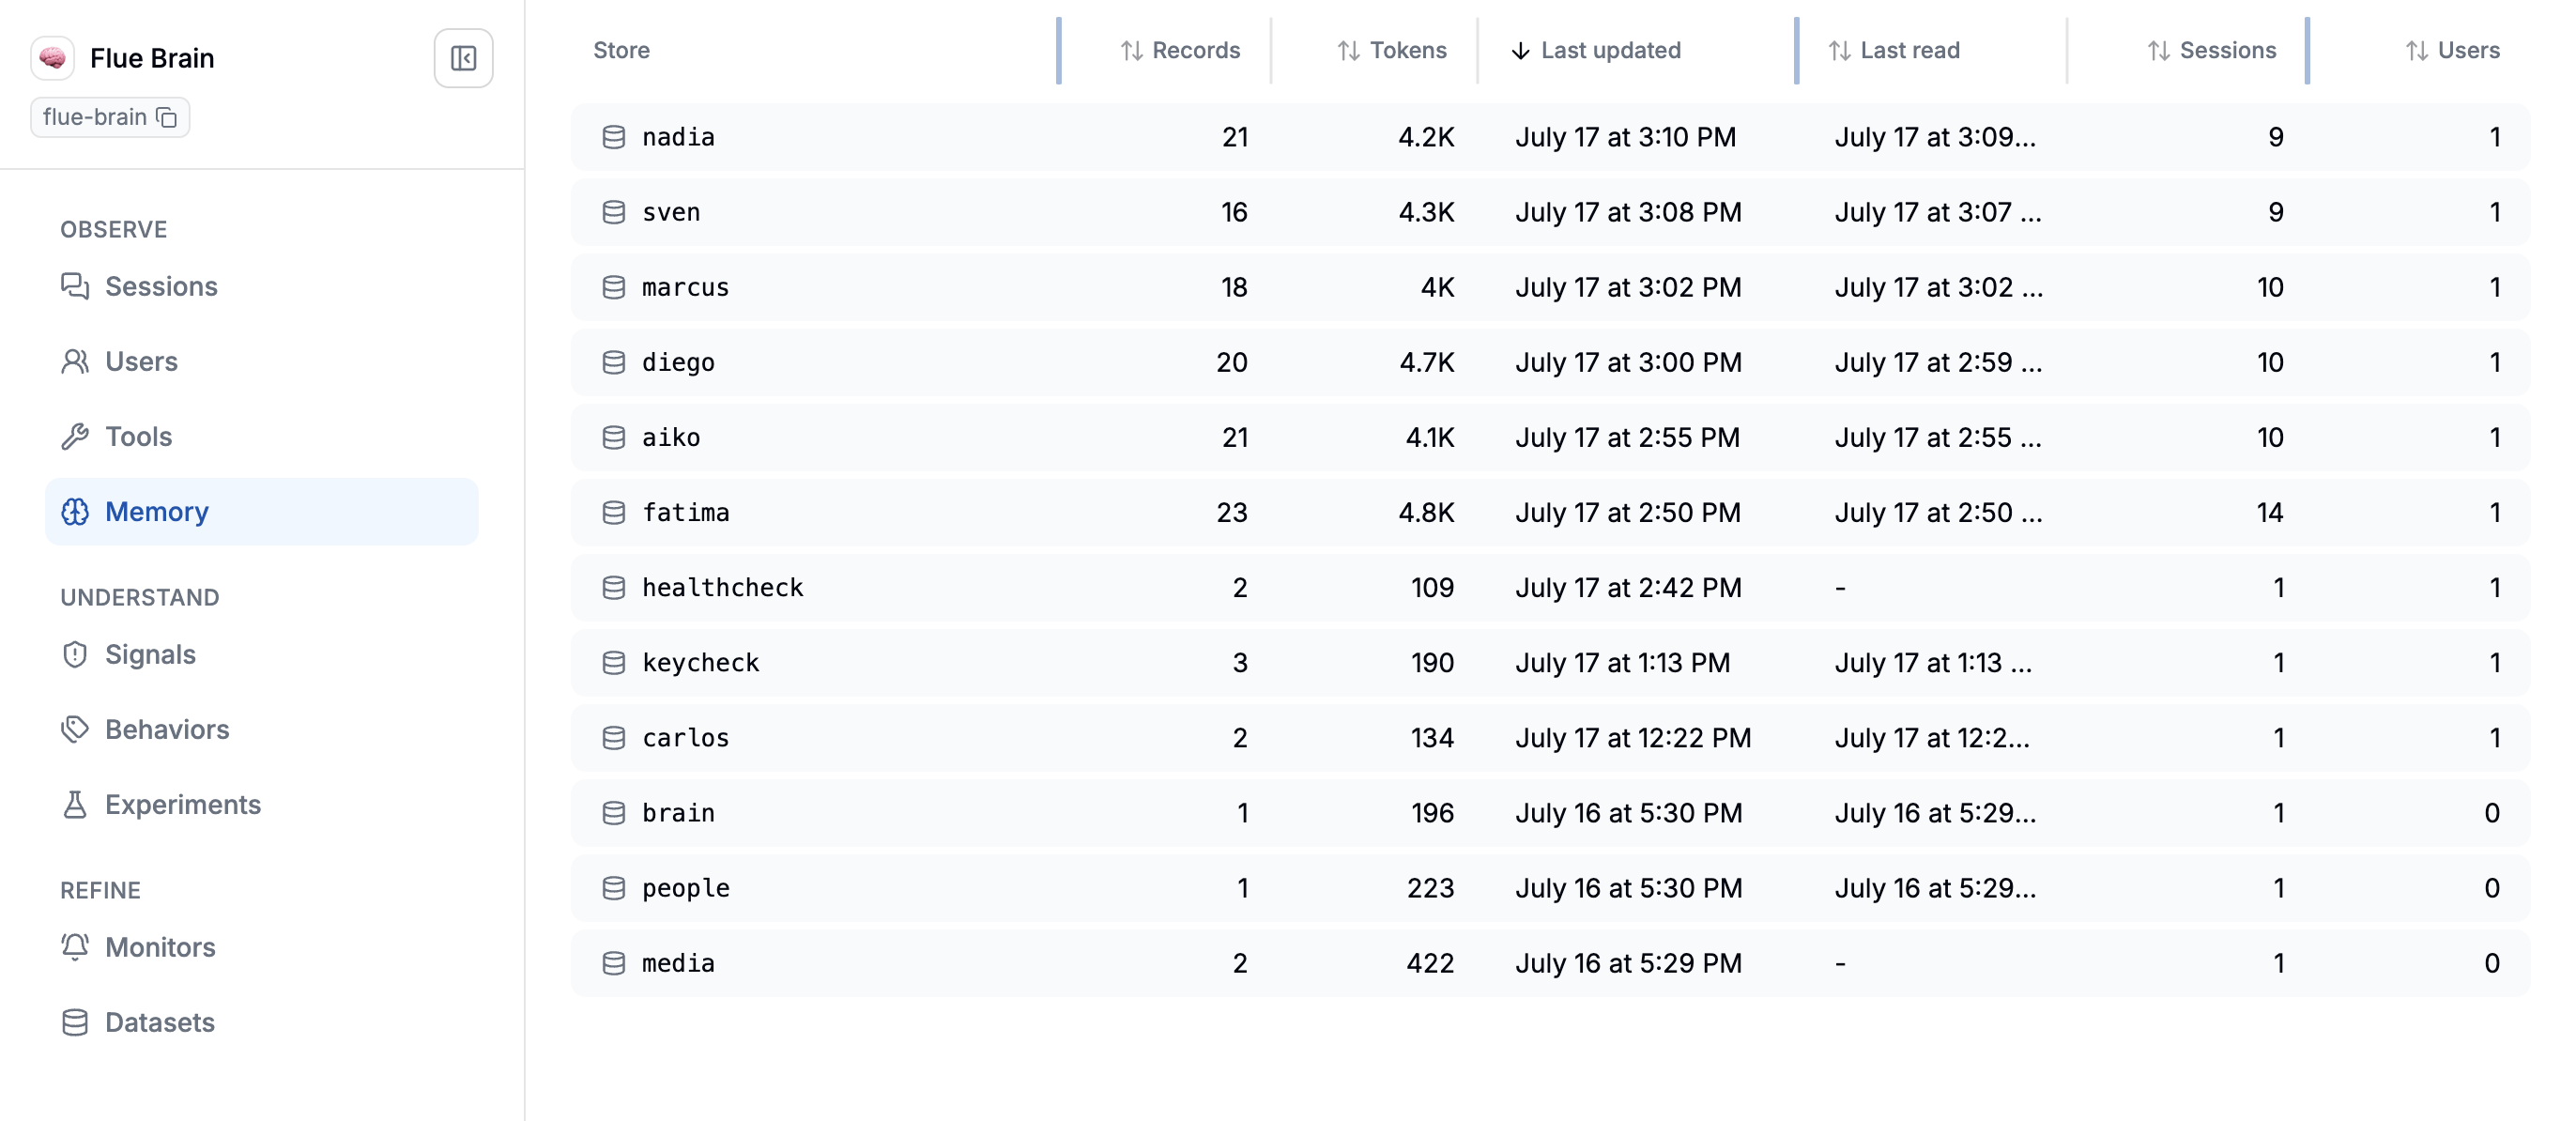
Browse stores like a repository
Open a store to browse it like a repo. Records nest into folders when their ids contain /, the center pane shows the selected record’s current body (rendered as JSON when it parses), and the header lists every user who accessed the store.
Below that, Record Activity covers the full lifecycle:
- Changes — write history with token deltas, linked to the span, session, or trace that caused each write
- Reads — every retrieval, with the search query, tokens returned, and the user
- Users — a per-user roll-up of reads and writes on that record
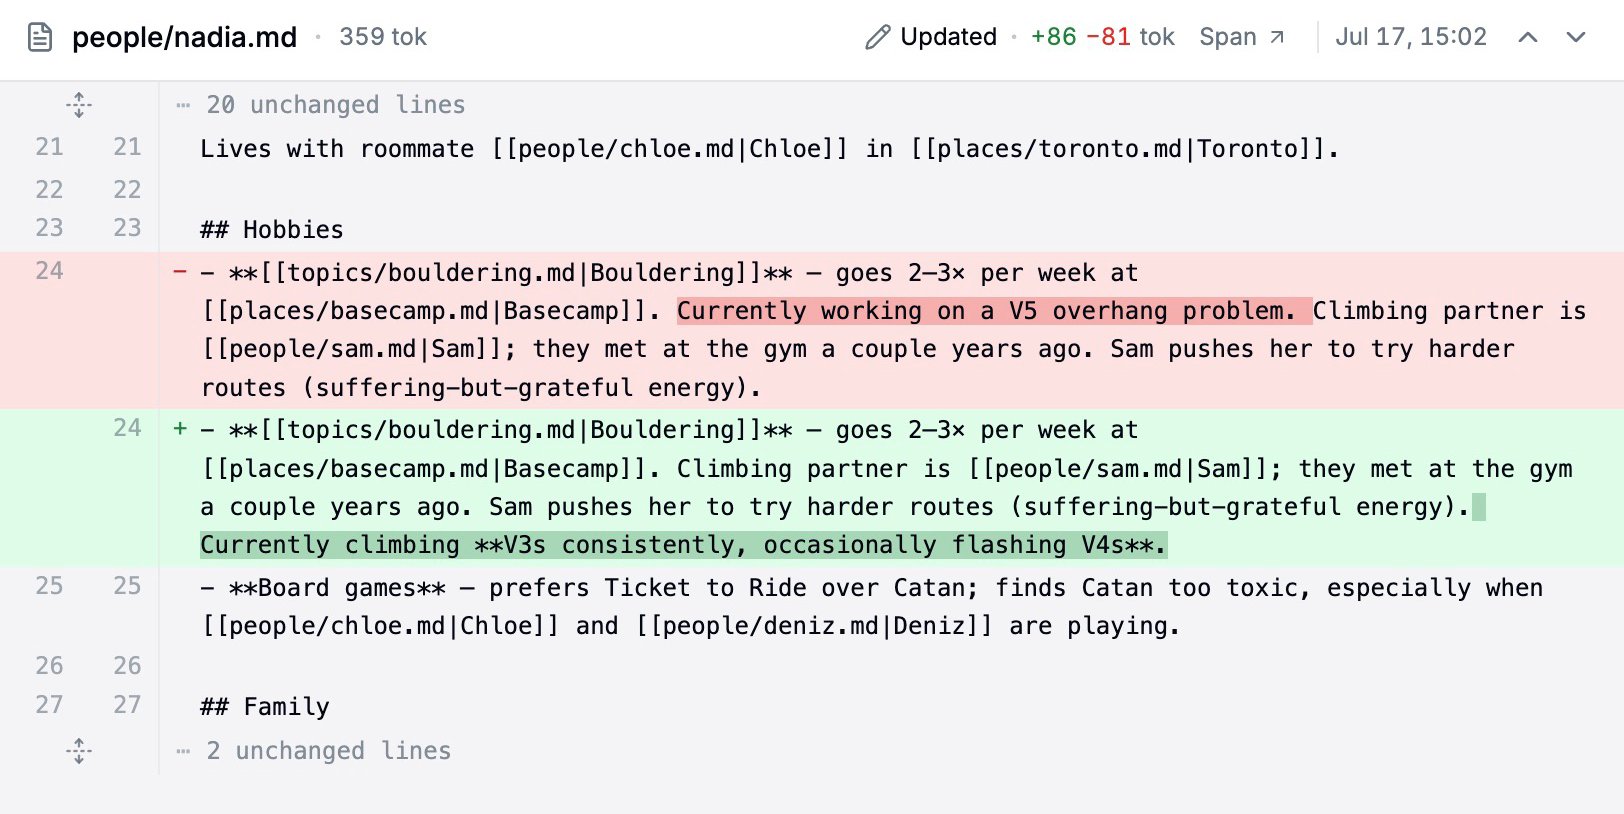
Diff every change
Select a change and the content pane swaps for a GitHub-style unified diff against the previous version, with per-word highlighting and a +added −removed token summary. Arrow controls step through history, and each change is shareable by URL so you can send a teammate straight to the write that corrupted a record.
Memory on traces and sessions
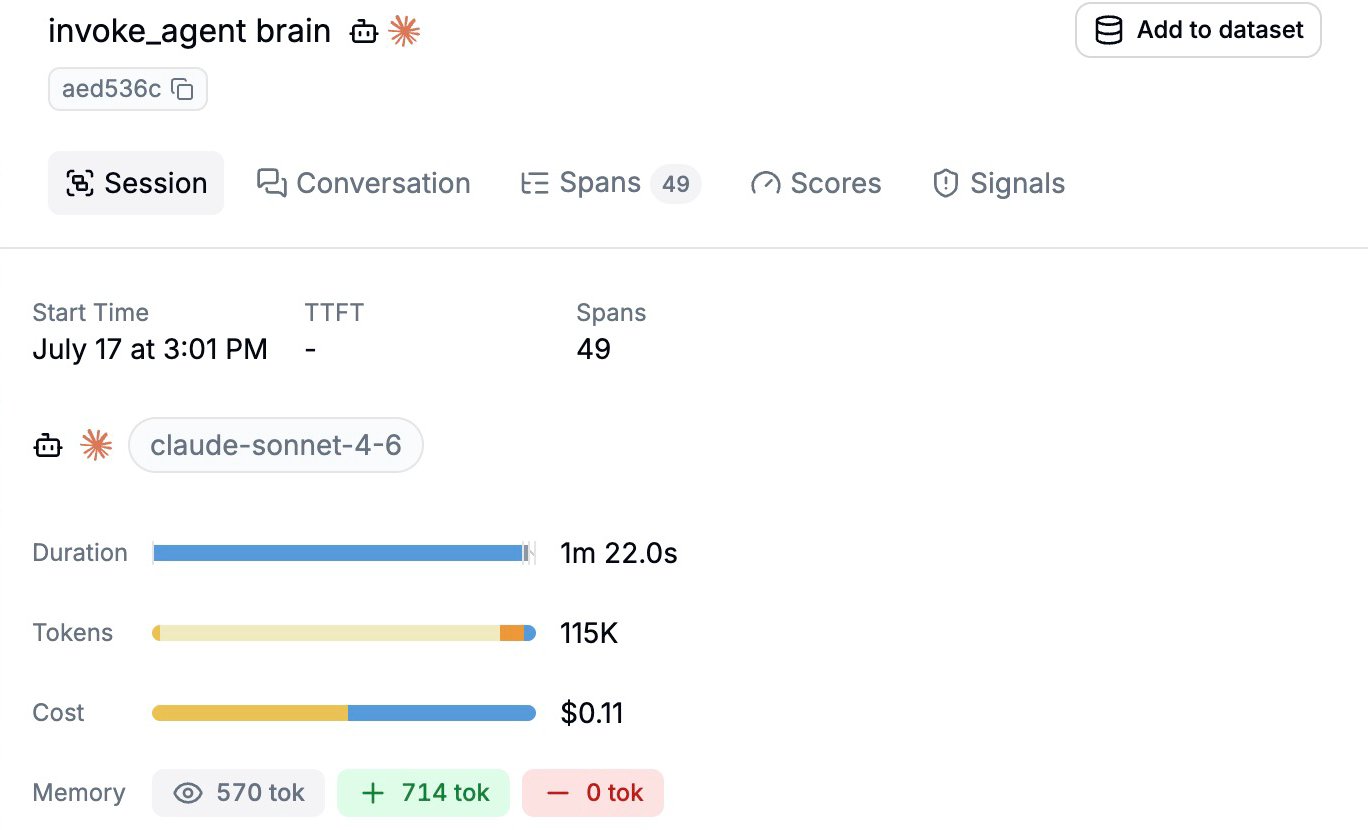
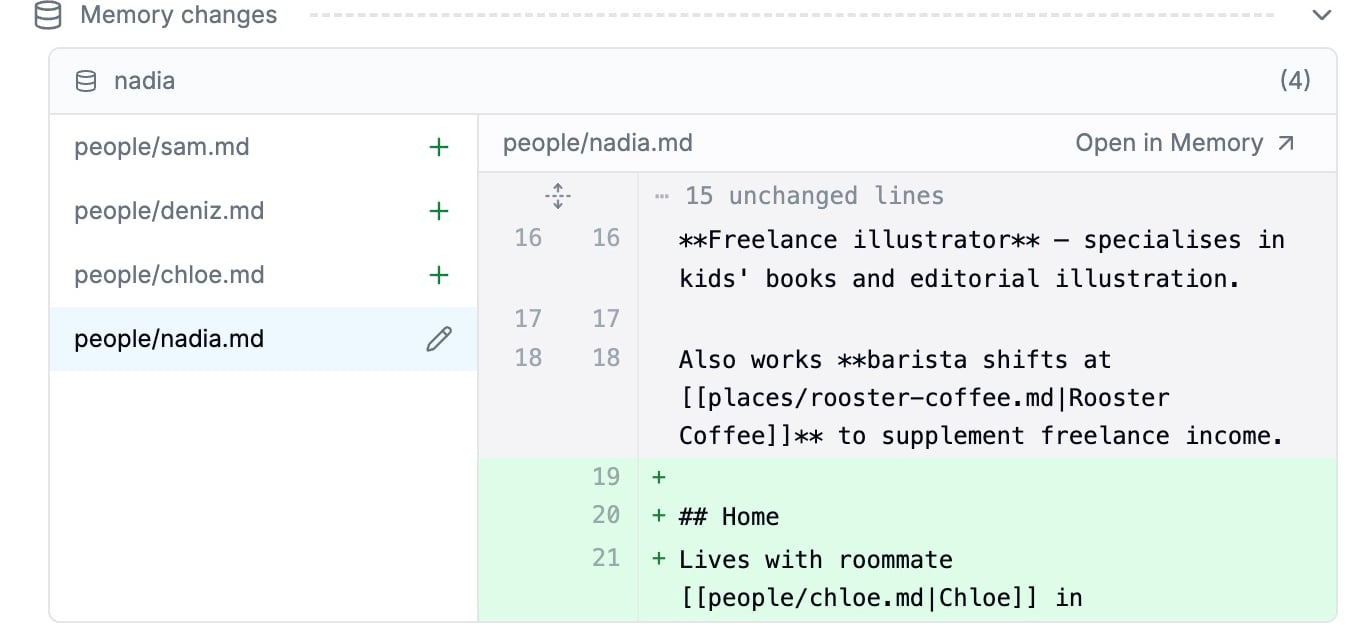
Trace and session detail views include a Memory row summarizing tokens read, added, and removed. Hover it for a per-record breakdown grouped by store. A collapsible Memory changes section lists the per-record diffs the interaction produced.
First-class memory spans
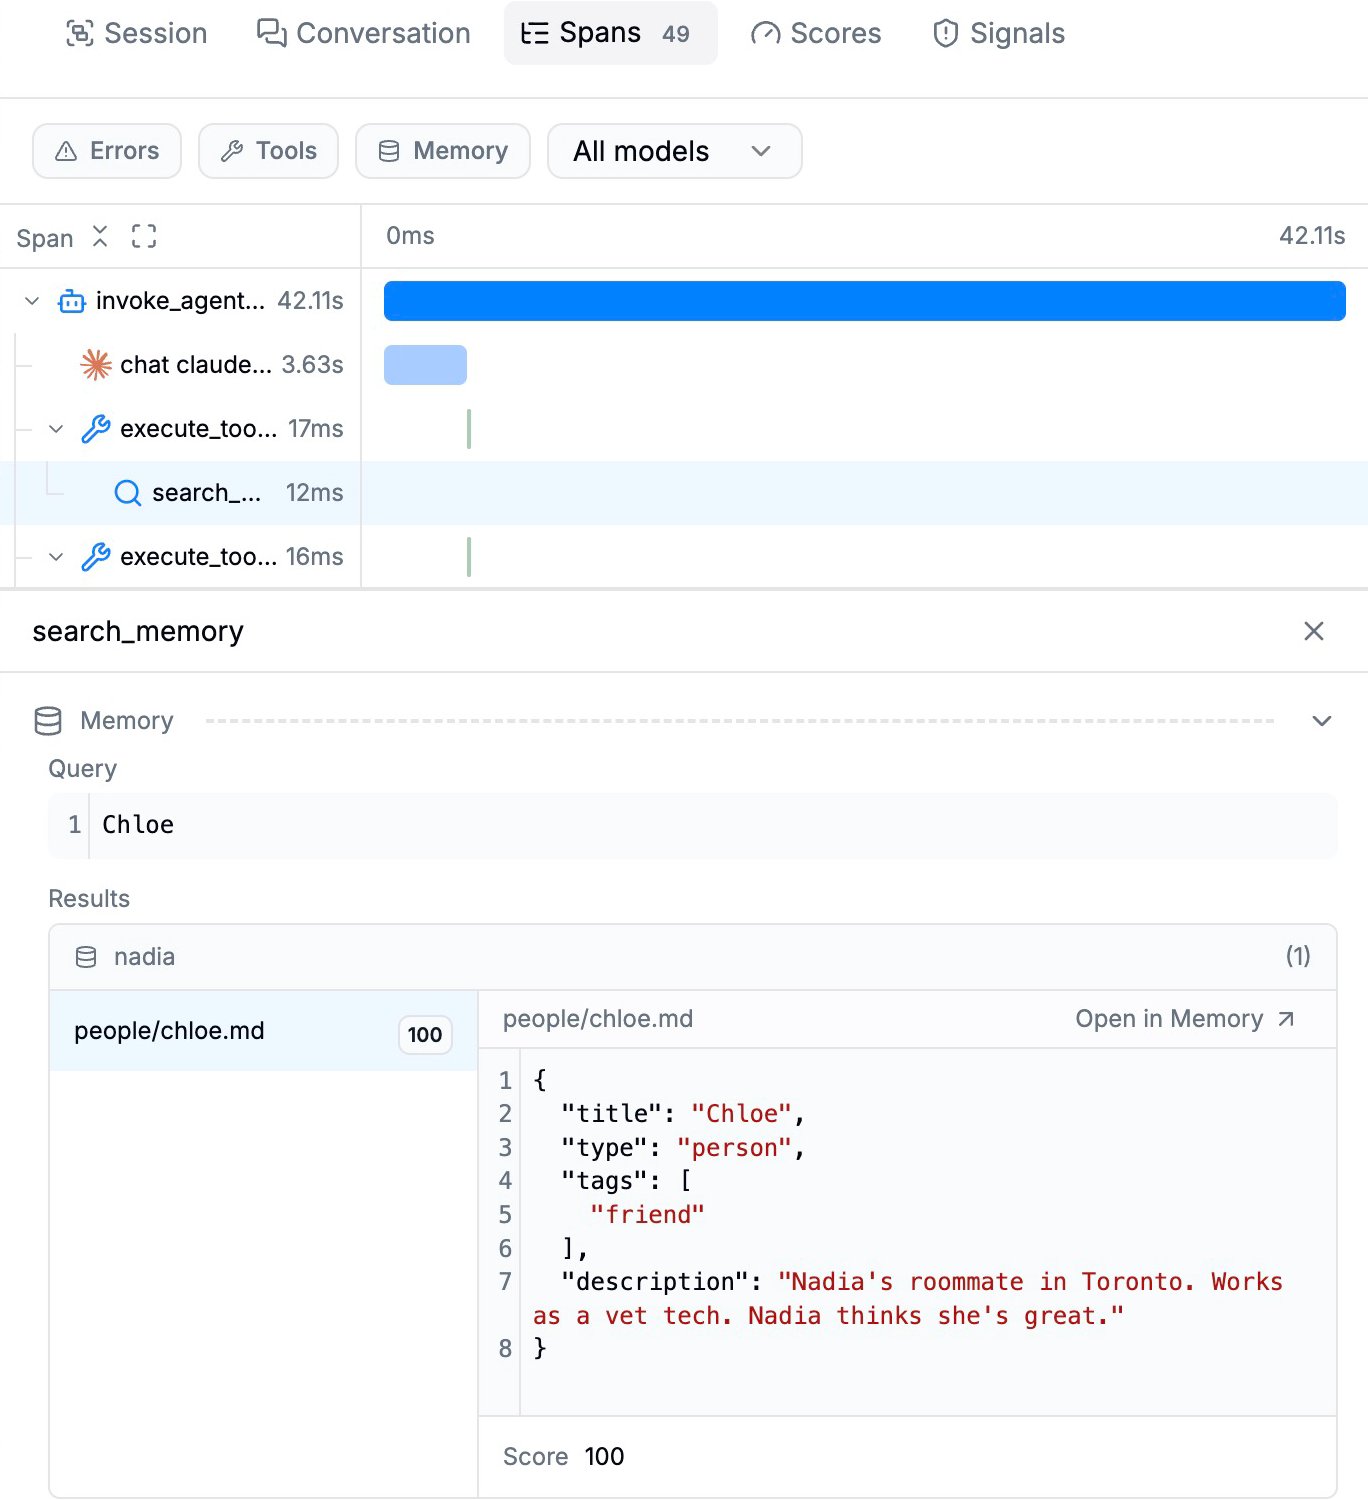
Memory operations are first-class spans. They get their own color in the trace waterfall, a Memory filter on the Spans tab, and a detail panel with the operation’s store, query, and records — including relevance scores on search results.
Get started
Not emitting memory operations yet? Instrument your agent with Memory tracing, then explore the data on the Memory page.