
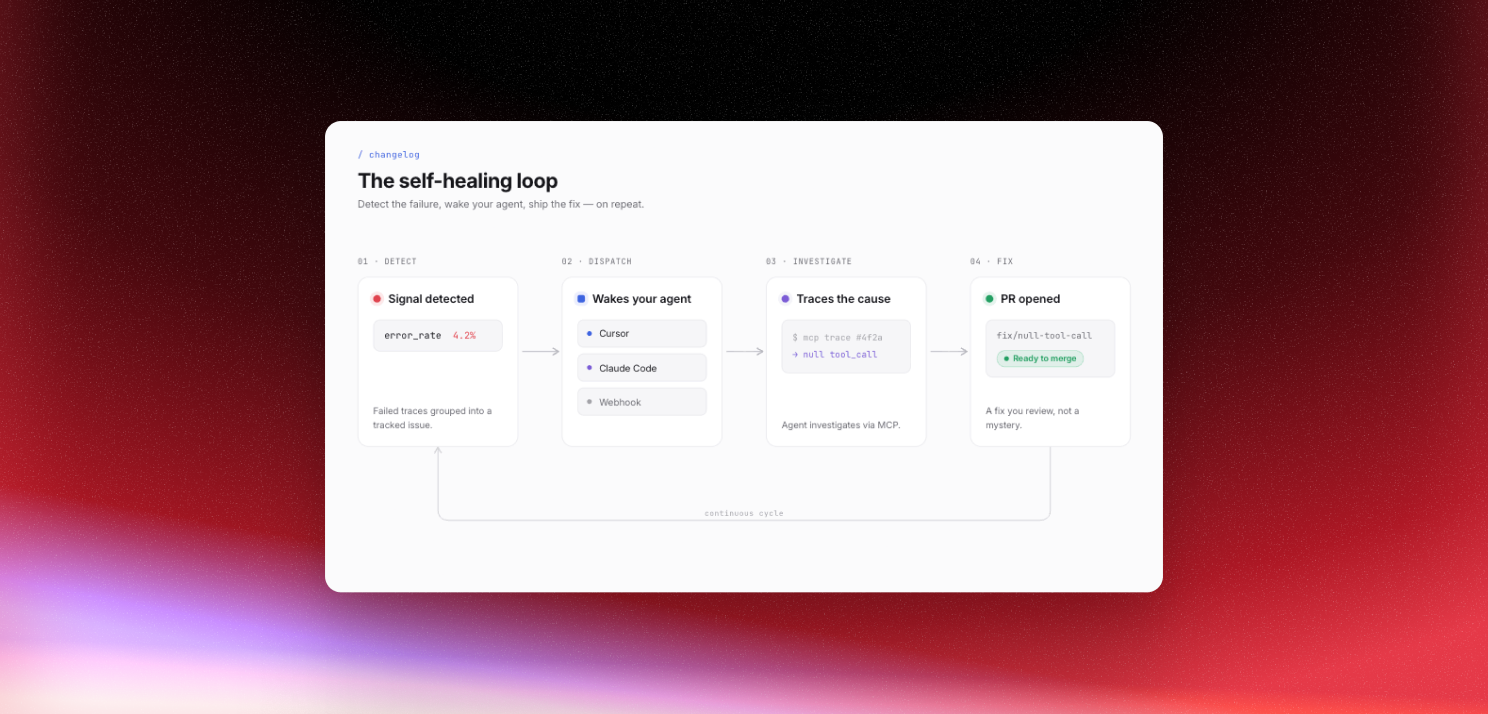
The theme this month is a loop finally closing. Latitude has always been good at showing you when an agent misbehaves. Over the last few weeks we shipped the pieces that let it act on that on its own, from detecting a failure all the way to a reviewed pull request.
The self-healing loop, end to end
Agent Dispatch went generally available. When Latitude detects a new signal, an escalation, or a monitor incident, it assembles a context-rich prompt and wakes your coding agent, whether that is Cursor, Claude Code, a Linear workflow, or a webhook you control. The agent investigates through Latitude’s MCP, traces the failure to its cause, and opens a pull request on your side.
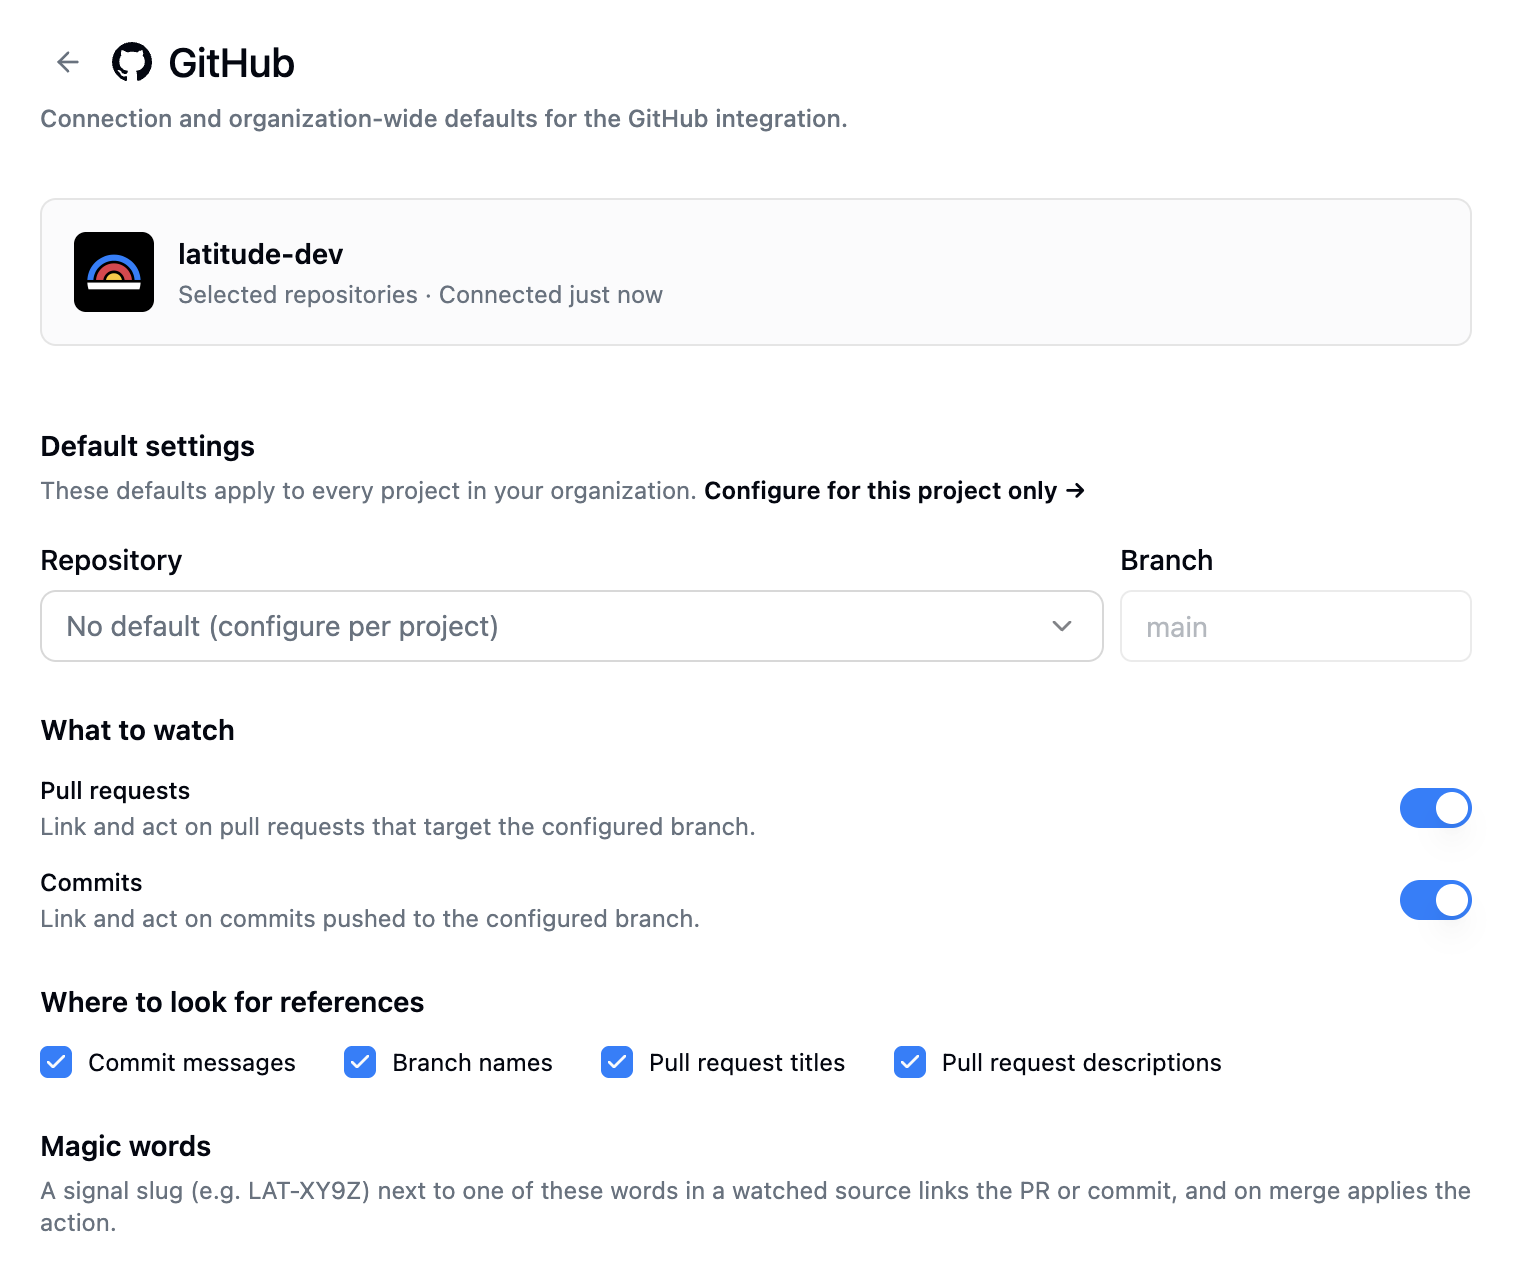
The GitHub integration closes the other half. When the pull request or commit that references a signal merges into a branch you watch, Latitude resolves the signal automatically, and reopens it if the fix gets reverted. It works like GitHub’s own Fixes #123, but for your signals, and it asks for read-only access only. Together, detect, dispatch, fix, and verify now run without a human starting each step.
New ways to understand your traffic
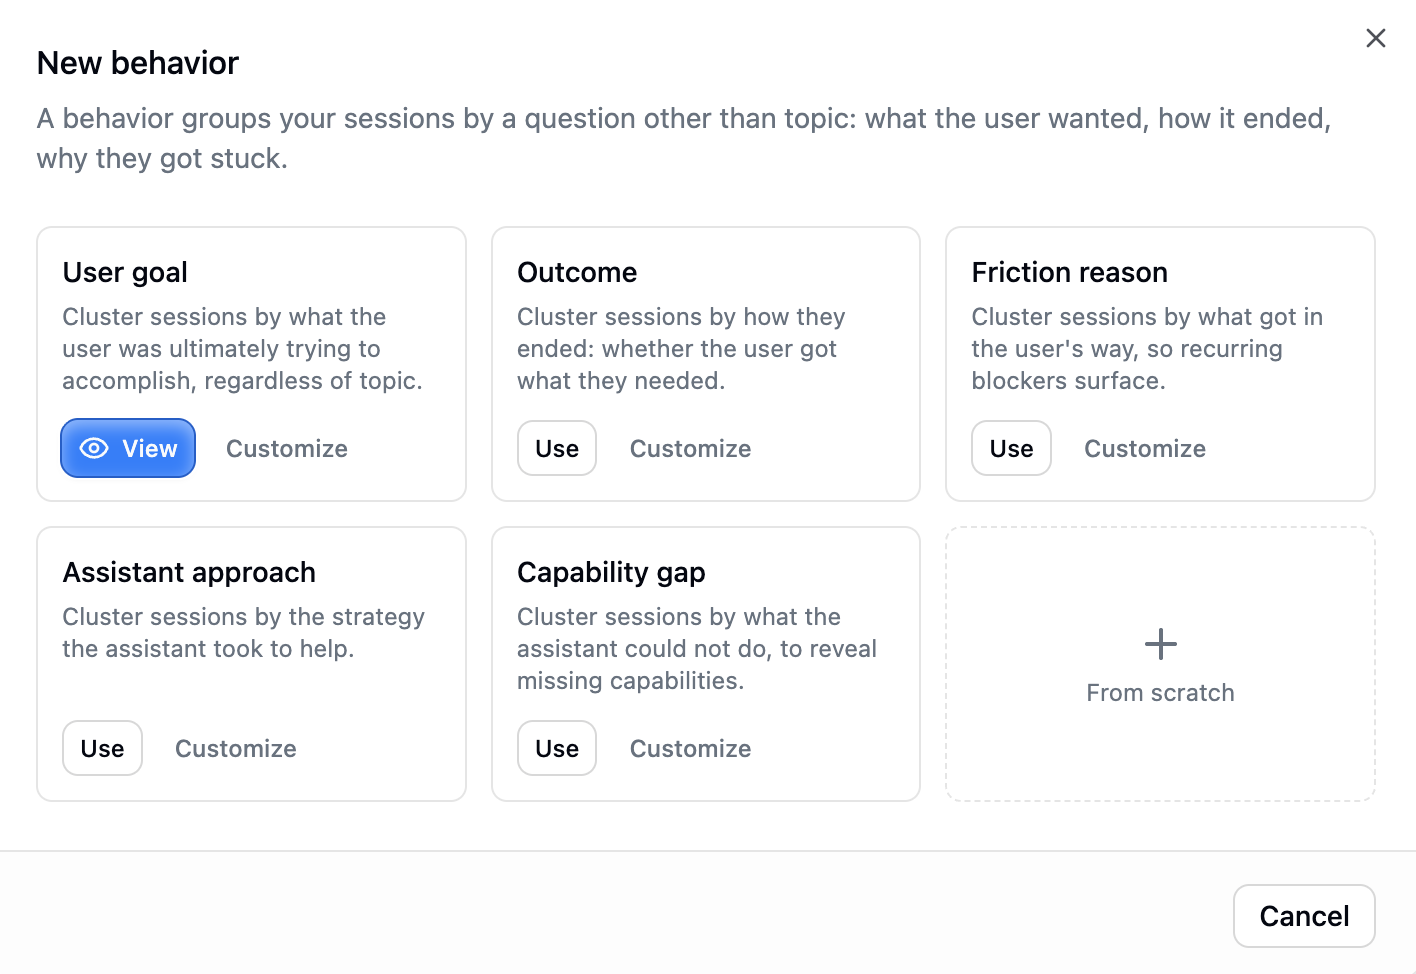
Behaviors became a catalog you can shape. Topics still ships by default, and now you can add groupings that cluster the same sessions by a different question, such as what the user was trying to accomplish, how the conversation ended, or what got in their way. You can also save filtered views under any behavior. Adding behaviors beyond Topics is in early access.
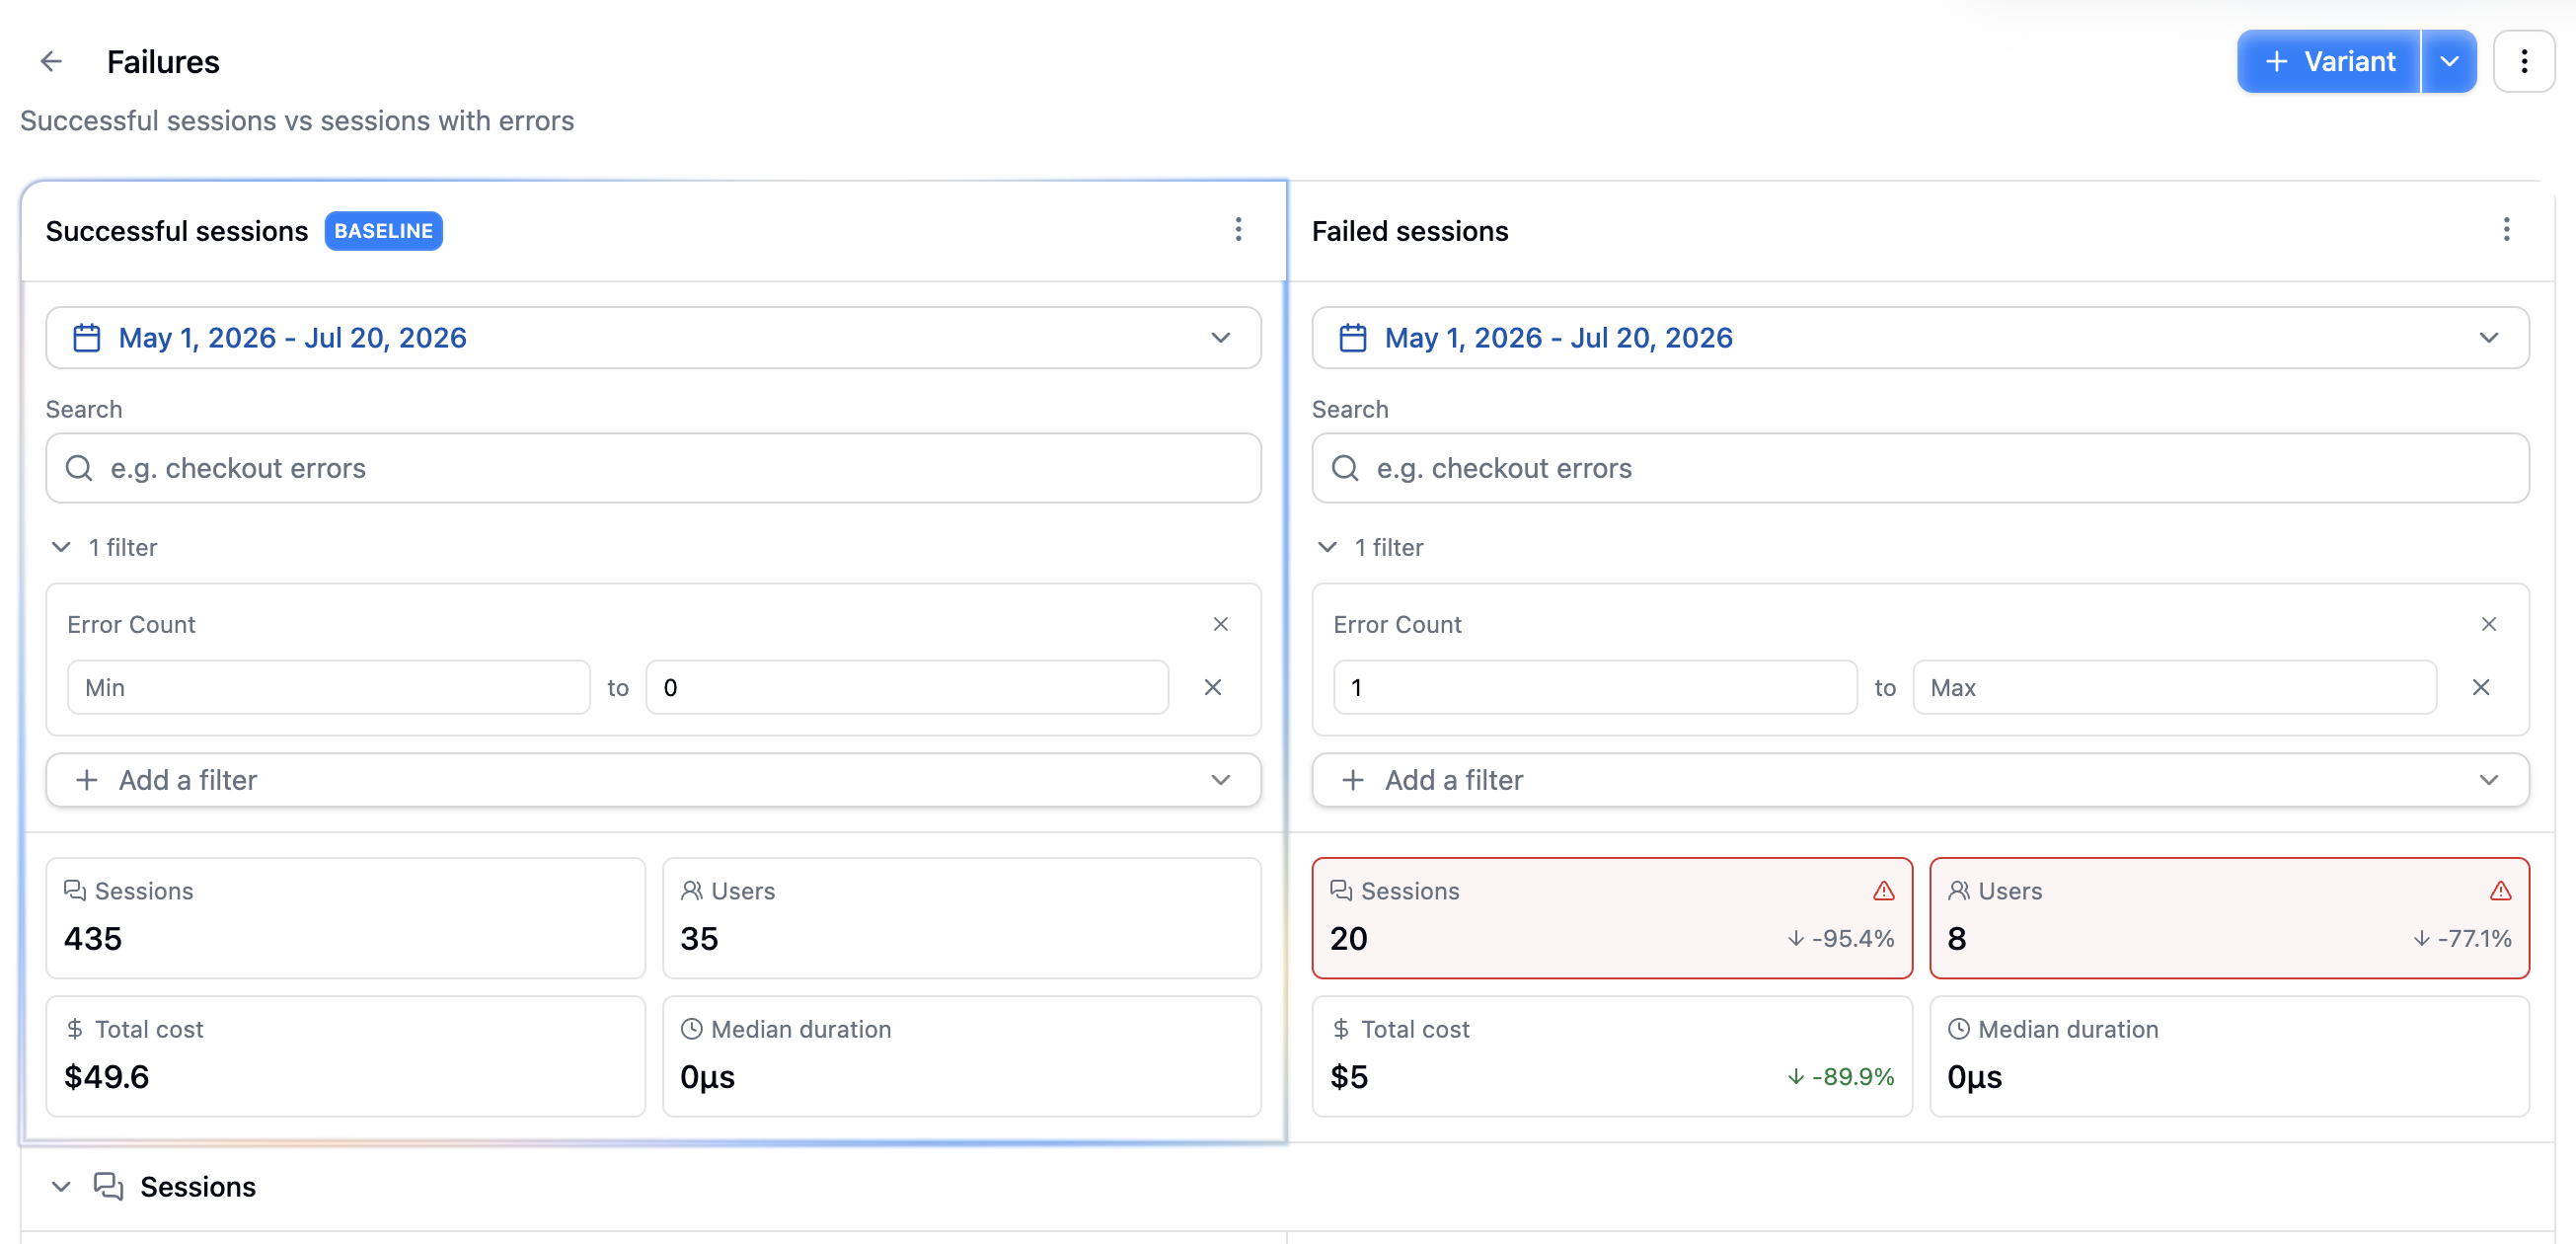
Experiments arrived for comparing variants on real production data. Each variant is a slice of your traffic defined by a search, filters, and a time range, and Latitude shows the deltas side by side across cost, tokens, error rate, duration, and more, colored by whether each change is an improvement or a regression.
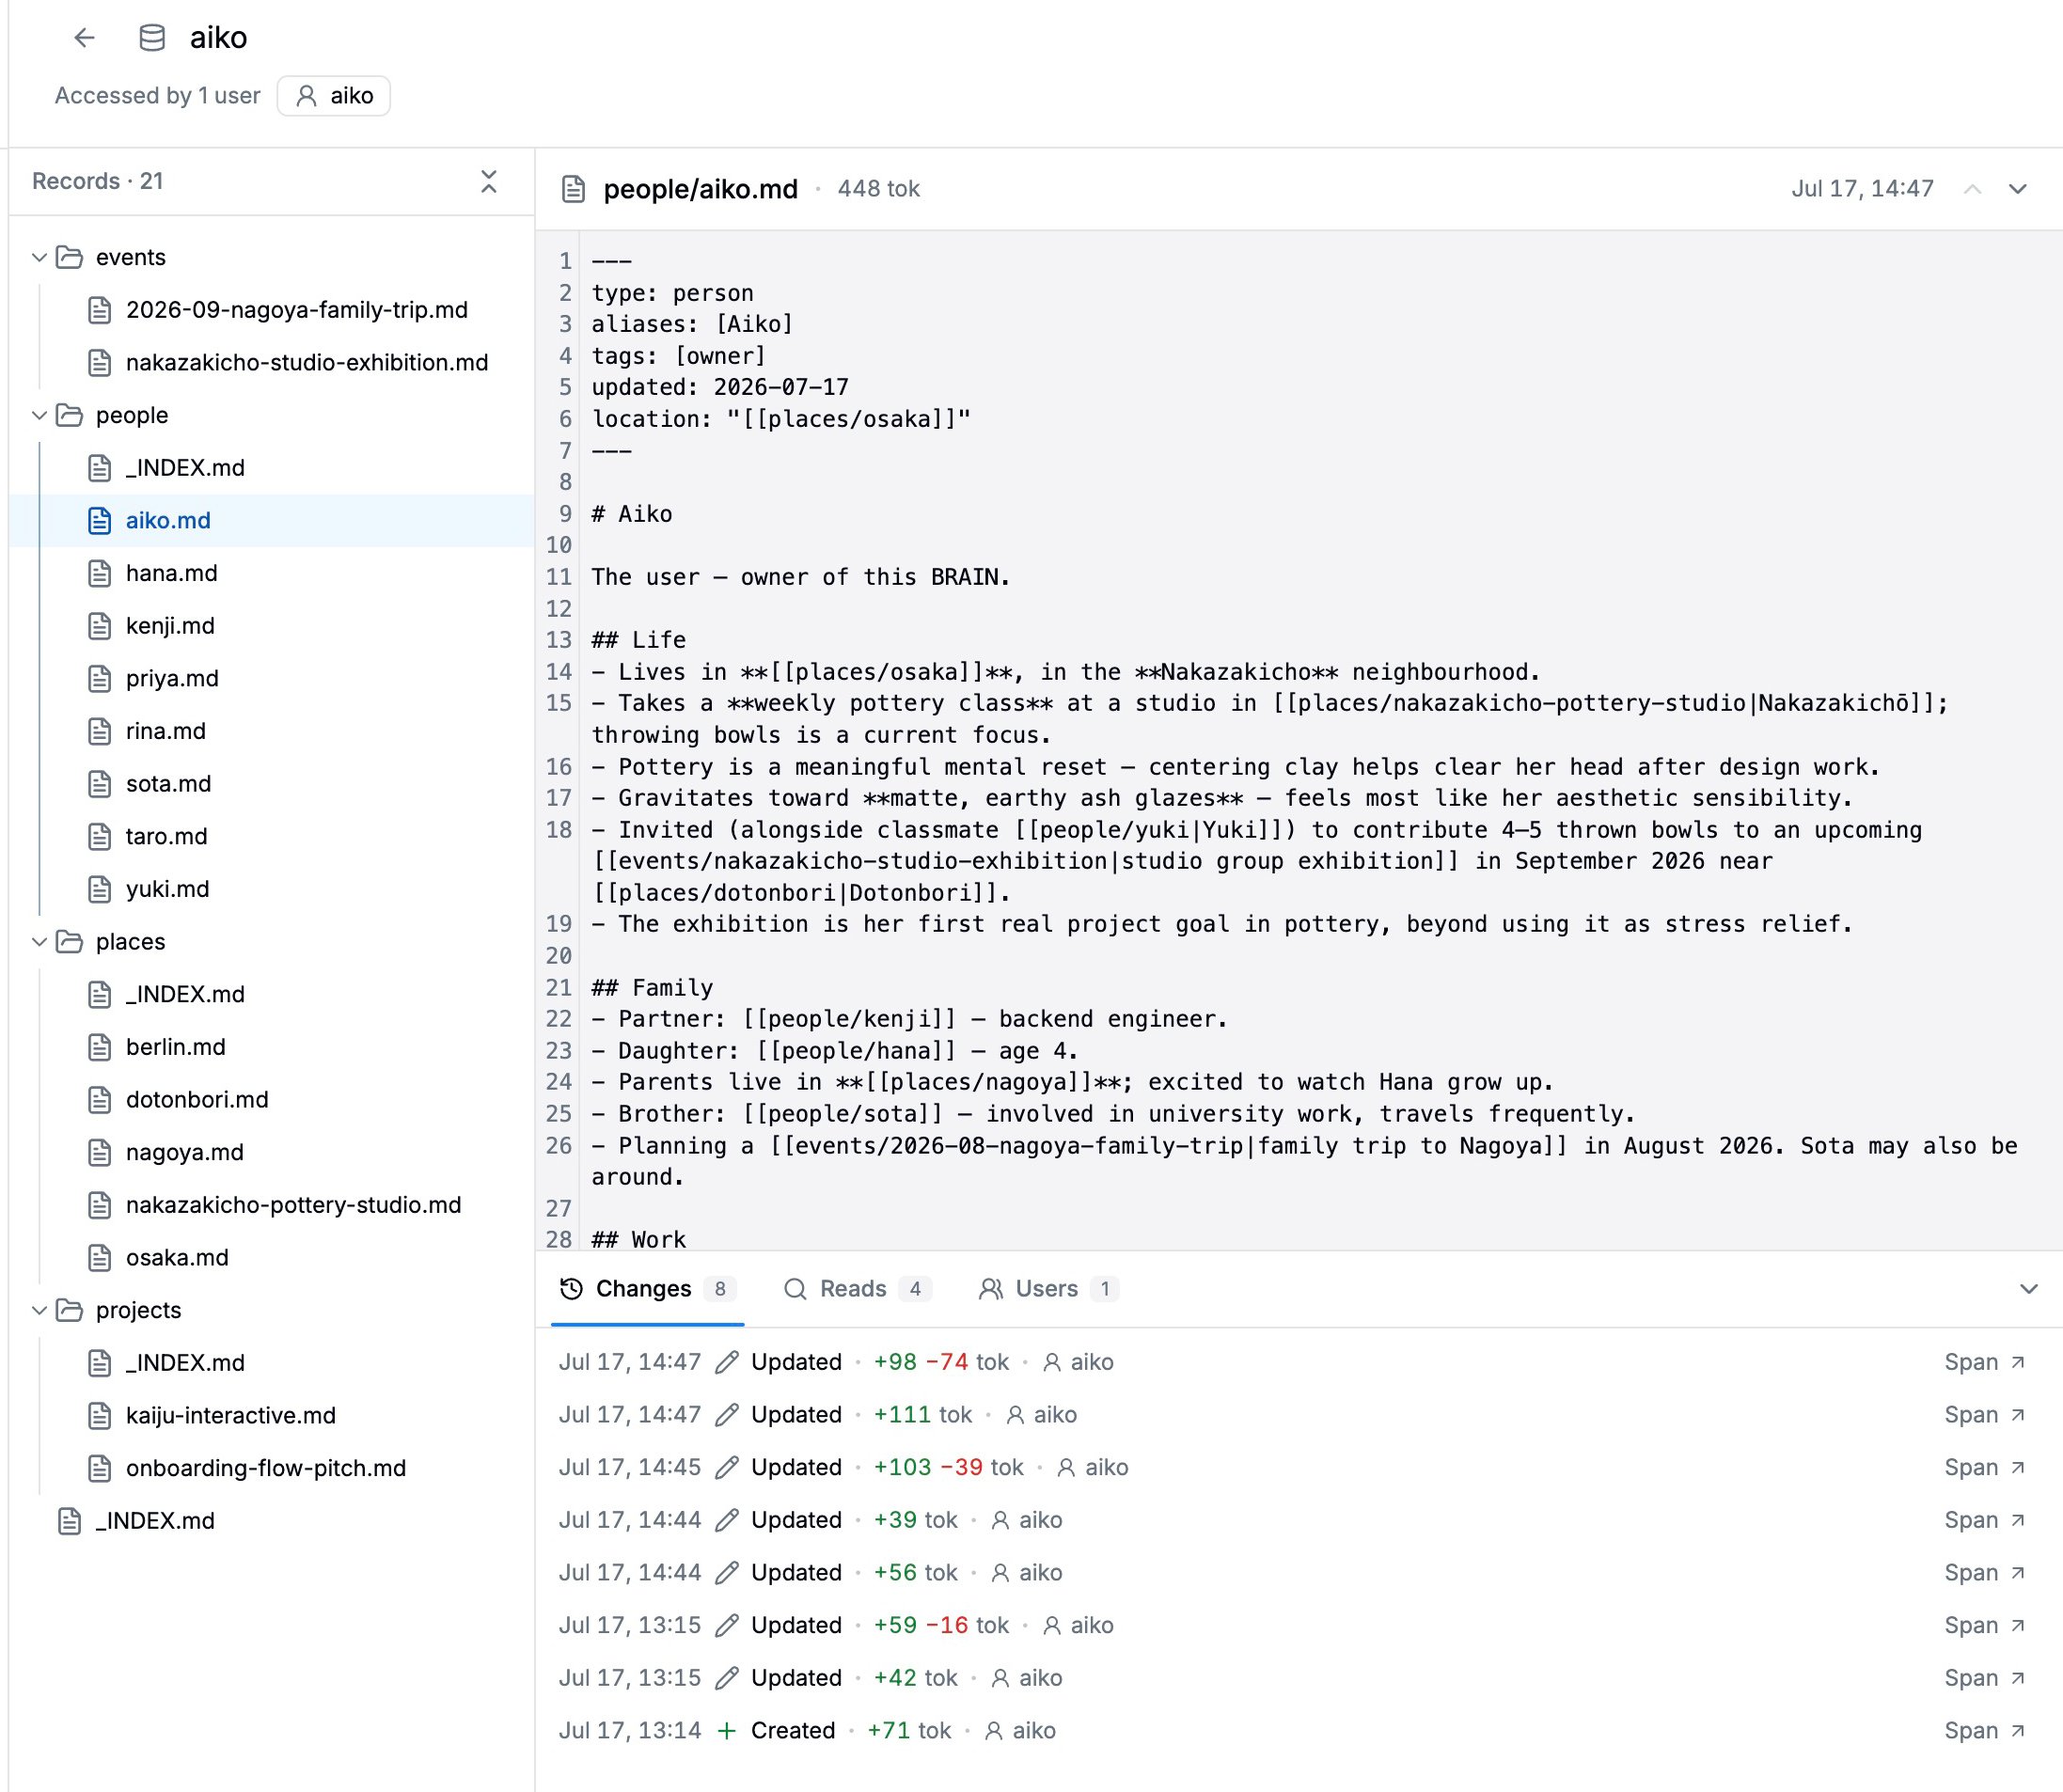
Memory observability landed for agents that keep persistent memory. The new Memory page records every memory operation as a versioned commit, with per-record history, a diff for every change, and the session behind each write. Every trace and session also carries a memory footprint, and memory is readable over the API, SDKs, MCP, and CLI.
Signals got more programmable
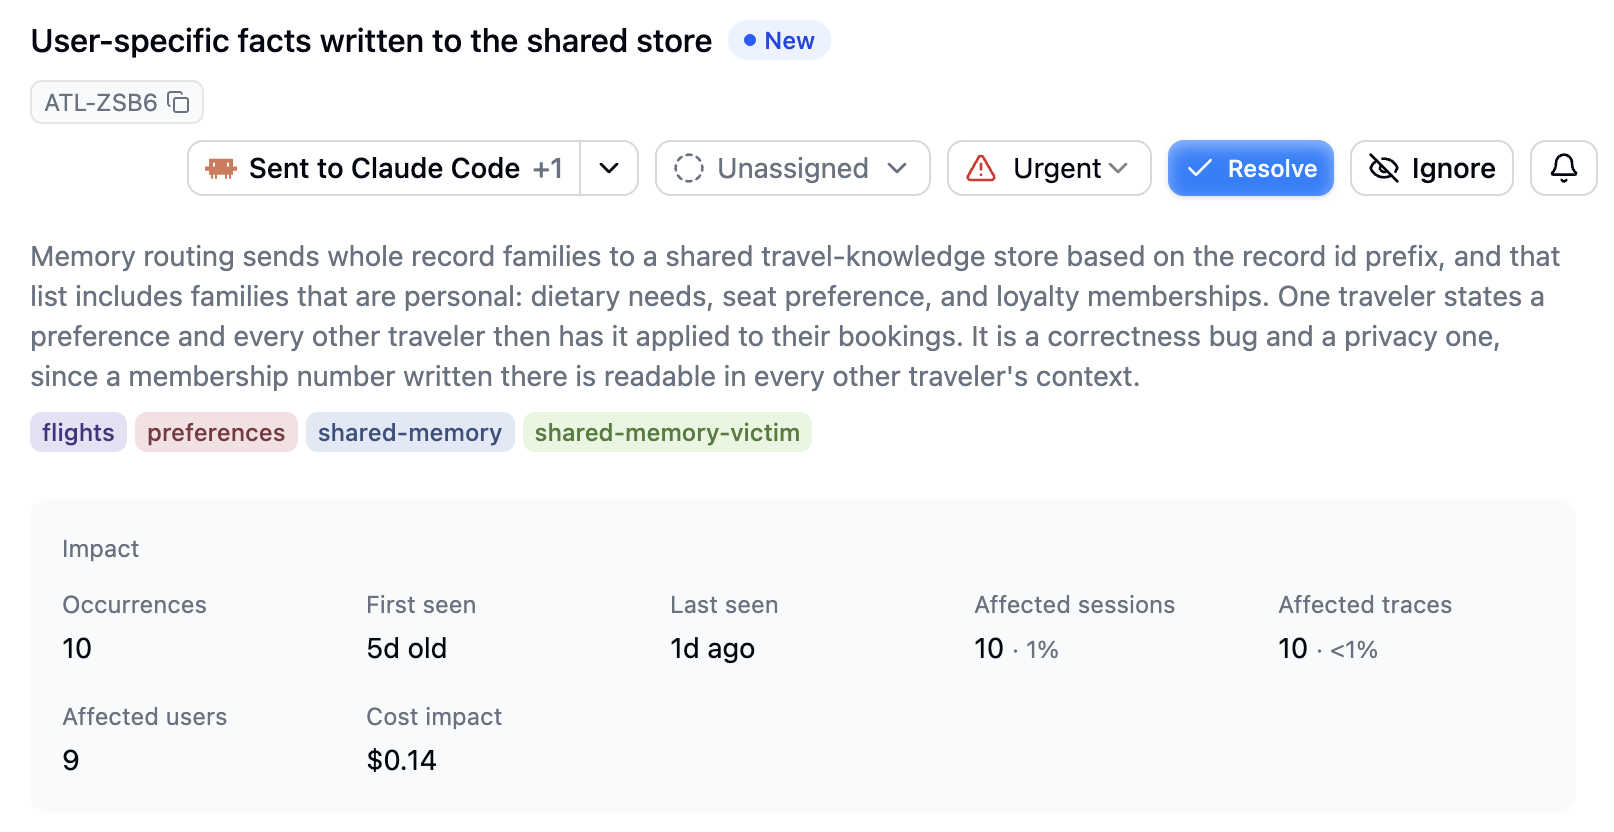
You can now author your own signals over the API, the SDKs, and MCP, not just the ones Latitude discovers. Signals also picked up short LAT-XY9Z slugs with slug-addressed detail pages, a restored resolve and ignore lifecycle with regression detection, and richer discovery notifications.
More ways to get data in
New integrations include the Cloudflare AI Gateway, which sends every routed model call to Latitude with no code change, plus a Prime Intellect telemetry export and native support for OpenClaw’s OpenTelemetry exporter and Vercel AI SDK v7. There is also a new Sessions API across HTTP, MCP, the SDKs, and the CLI, and you can now export sessions from Behaviors or Signals straight into a dataset to build a regression suite from real failures.
That is detect, understand, fix, and verify, all in one place. More next month.
Want to talk through any of this or tell us what to build next? Join our Slack community.