
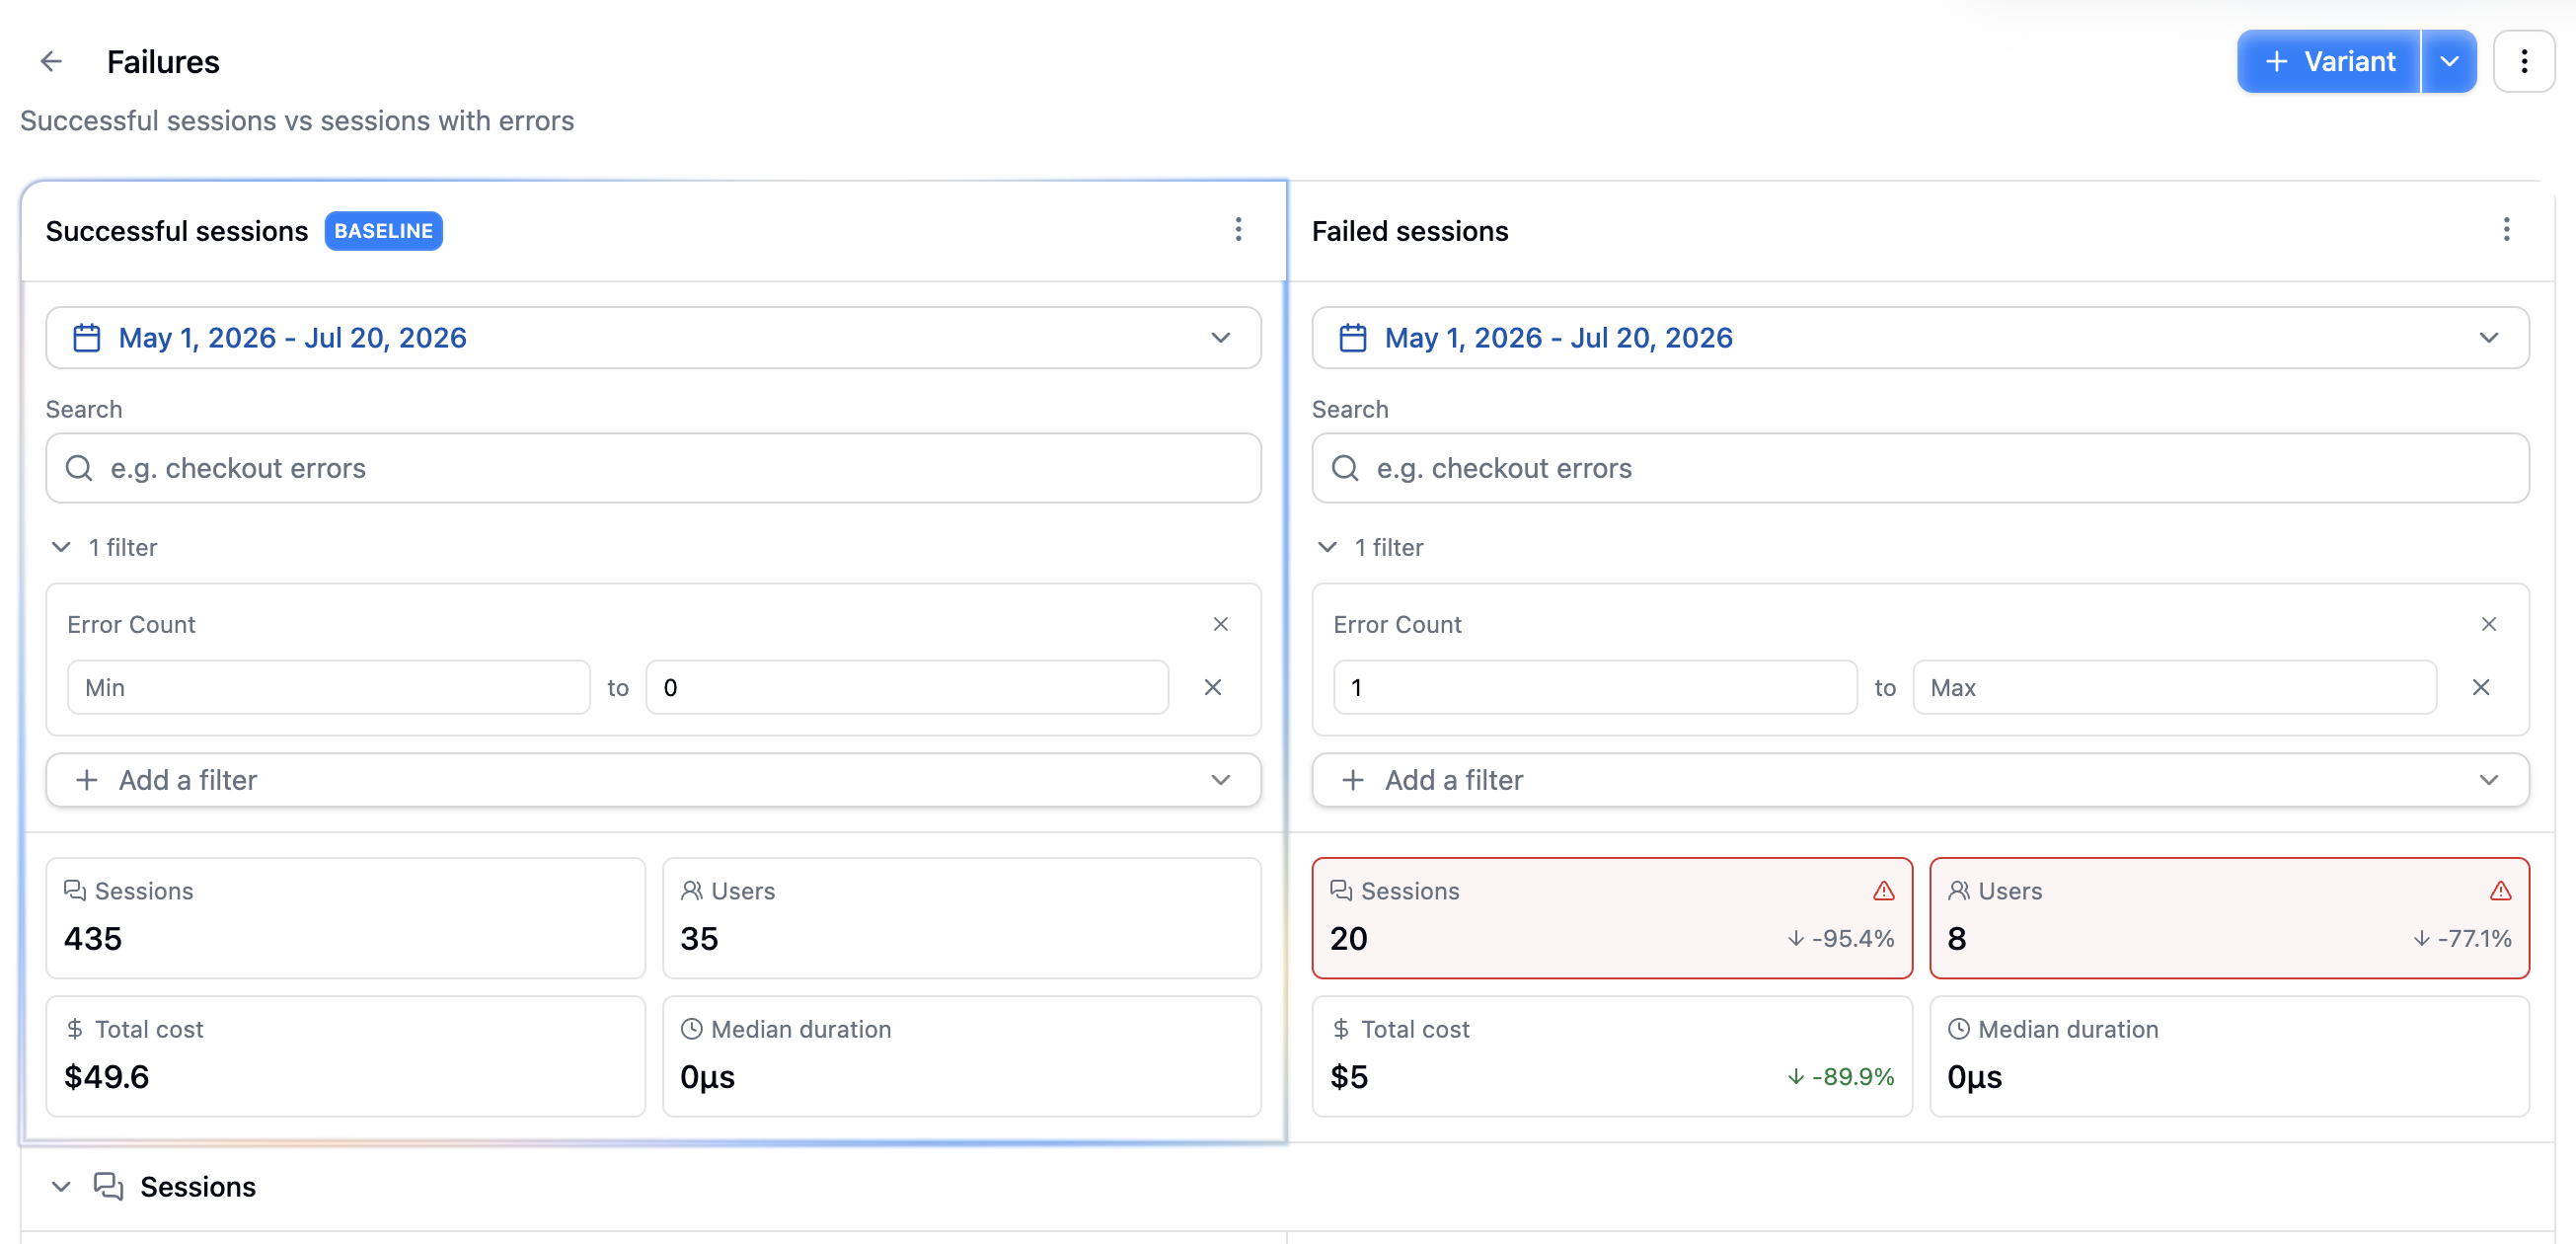
You shipped a new version, swapped a model, or changed a prompt. Did it actually make things better, or just different? Experiments answer that from your production traffic, with no A/B test to instrument.
An experiment compares variants, and each variant is a slice of your traffic defined by a search query, filters, and a time range. Latitude computes the metrics for each variant and shows you the deltas side by side, across sessions, users, tools, signals, and behaviors.
Pick a preset and you have a comparison in seconds:
- A/B Test splits traffic by an A tag and a B tag
- Versions puts your current version against the last three tagged versions
- Failures compares successful sessions against sessions with errors
- Outliers puts normal sessions against the longest, costliest, and slowest to first token
- Seasonal spreads four variants across the year, or start from Custom with two empty variants
Once it runs, each variant becomes a card with headline panels for sessions, users, total cost, and median duration, and a full metric breakdown below. Every delta is measured against your baseline variant and colored by direction, so a rise in cost or error count lights up while a genuine improvement reads as a win.
Available now in the API and MCP too, so you can spin up variant comparisons from your own tooling.