
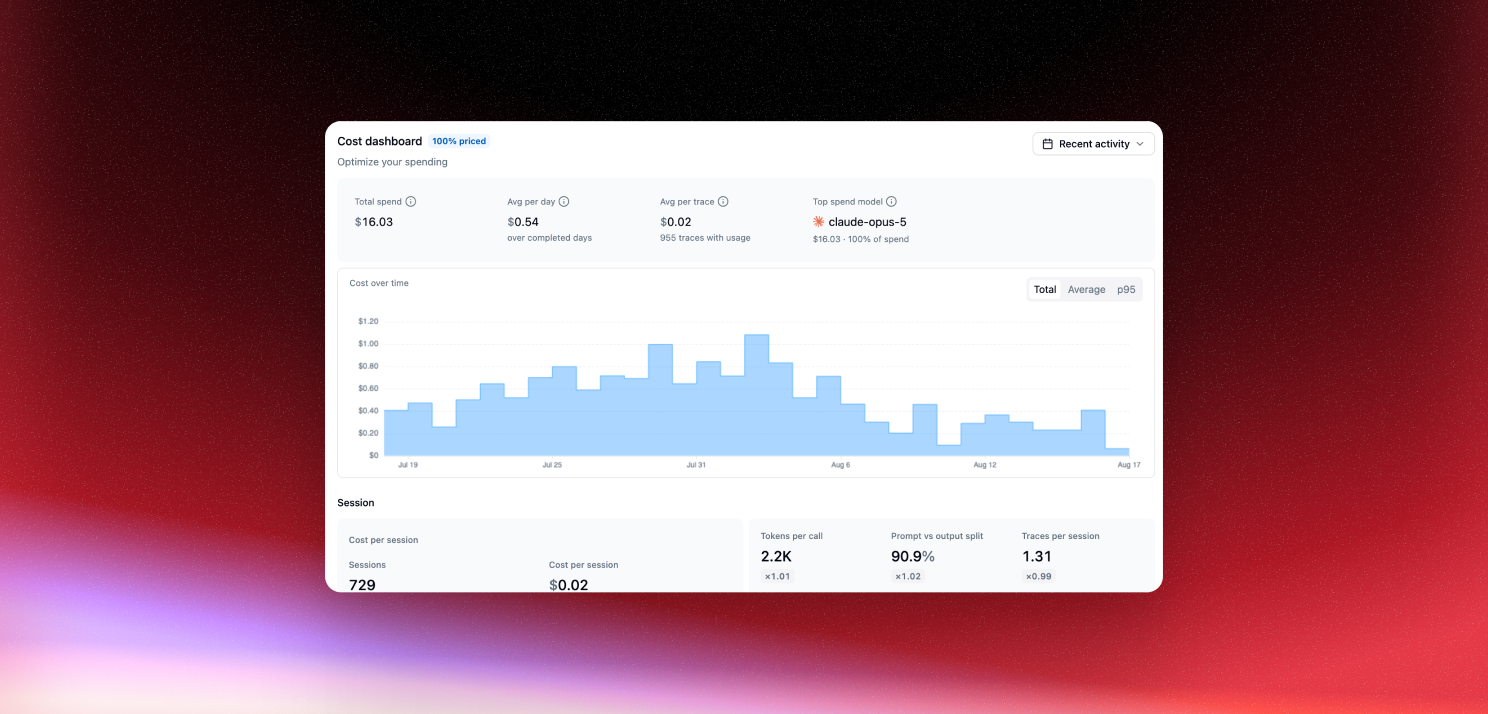
Knowing your agent costs money is easy. Knowing where the money goes is the hard part. The new Cost dashboard breaks your spend down to the session, the model, and the prompt cache, and points you at the money left on the table.
It is organized into three views:
- Session — spend over time and cost per session, with a decomposition that shows whether the bill moved because you had more sessions or because each one got more expensive
- Model — a cost breakdown table and model usage over time, so you can see which models drive your spend and how the mix shifts
- Cache — cache economics per model, including the break-even point, the achievable ceiling if your caching were ideal, and the estimated savings between the two
The Cache view is the one to watch. Latitude classifies each model’s caching into one of six states, estimates what you would save by fixing it, and surfaces recommendation cards so the next optimization is obvious instead of buried in spans. A data-confidence panel shows how much of your spend is provider-verified versus estimated, so you know how far to trust the numbers.
The Cost dashboard is in early access, enabled per organization. Want in? Reach us at hello@latitude.so.