

If your LLM app returns HTTP 200 every time, that does notmean it works. I’d track failures with four buckets: ops, quality, structure, and safety - then tie each issue to traces, live scoring, review, alerts, and regression tests.
Here’s the short version:
-
Name failures clearly. Use a small set of tags like hallucination , truncation , timeout , rate_limit , refusal , and tool_call_malformed.
-
Log each request as a full trace. I’d store prompts, outputs, model name, prompt version, latency, token use,
finish_reason, retrieval data, and cost data. -
Score live traffic. Run code-based checks on 100% of traces and use judge models on flagged or sampled cases.
-
Review bad cases with humans. Then turn those reviewed failures into tests that block bad prompt or model changes later.
-
Alert on drift, not noise. Watch latency, cost, groundedness, safety failures, and rolling score drops over time.
-
Trace agents step by step. Multi-turn systems can lose context by 15%–30% after 10+ turns , so single-response logs are not enough.
-
Add spend limits. One agent loop example drove weekly API spend from $127 to $47,000.
I’d treat this as one loop: trace - > score -> review -> alert -> test.
A few numbers stand out:
-
A 0.3% failure rate can still hide major issues.
-
A 10% sample may inspect only a small slice of those failures.
-
Tail-based sampling of routine success traces at 5%–10% can keep storage in check while still keeping bad cases.
-
Groundedness alerts can fire when scores drop below 0.80.
-
Cost alerts can fire when spend jumps above 2x the daily baseline.
If I were setting this up, I’d keep the stack simple: one shared taxonomy, one tracing layer, one scoring path, one review queue, and one way to turn production mistakes into regression evals.
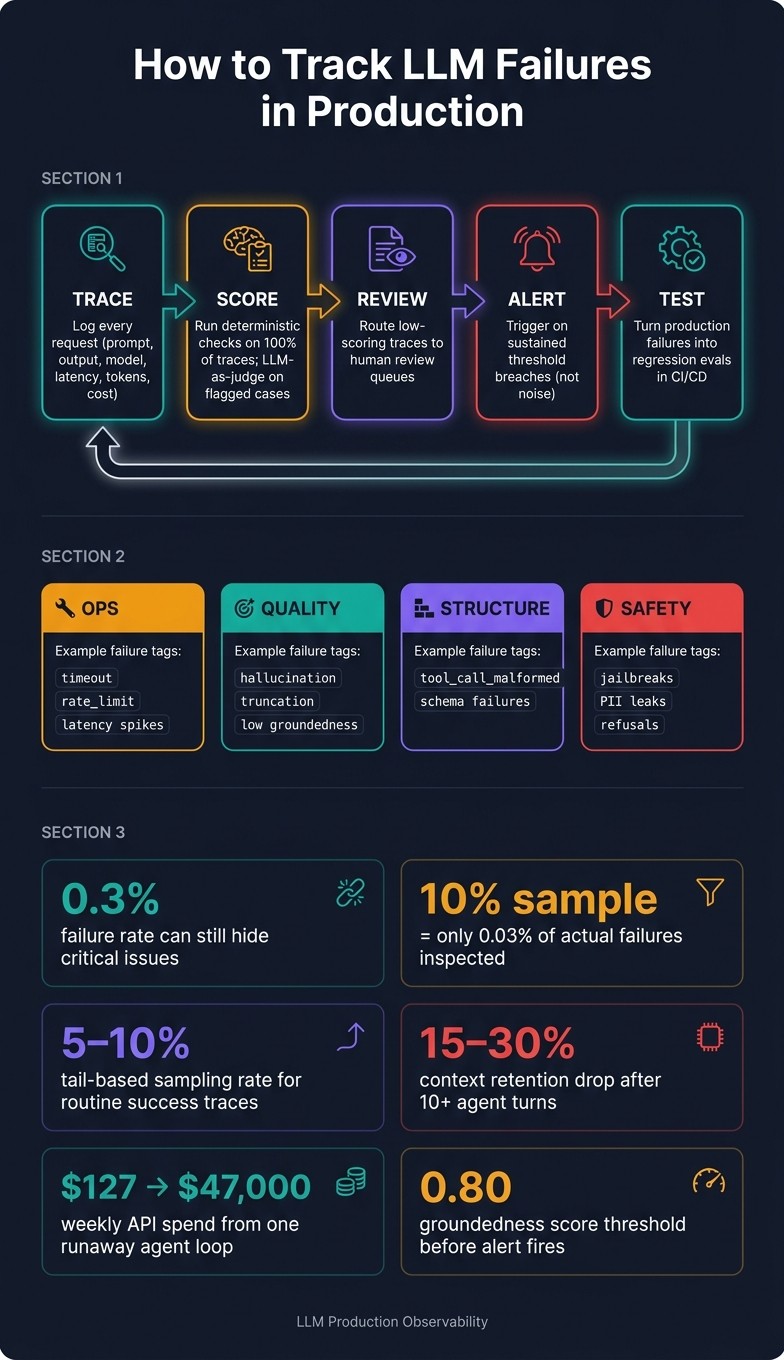
LLM Failure Tracking Loop: Trace → Score → Review → Alert → Test
Quick comparison
| Area | What I’d track | Why it matters |
|---|---|---|
| Failure types | Ops, quality, structure, safety | LLM errors often hide inside “successful” responses |
| Trace data | Prompt, output, model, version, latency, tokens, cost, retrieval, tool calls | Helps me find where the run went wrong |
| Live checks | Schema checks, tool arg checks, grounding, relevance, toxicity | Finds bad behavior that uptime tools miss |
| Alerts | TTFT, error rate, cost spikes, score drift, safety hits | Keeps teams focused on issues that stick |
| Review loop | Human review + regression evals | Stops the same failure from coming back |
| Tooling | LangSmith, Langfuse, Braintrust, Helicone, Latitude | Each fits a different part of the workflow |
In plain English: I would not trust uptime alone. I’d track what the model said, why it said it, how much it cost, whether retrieval and tools worked, and whether the same mistake can be blocked next time.
Build a failure taxonomy and capture the right telemetry
Use a simple taxonomy for tagging production issues
Track failures with one shared taxonomy. If you don’t, different teams will label the same problem in different ways, and the data stops being useful.
Use two buckets: transport failures , which show up through status codes and exceptions, and content failures , which hide inside successful responses. Keep the taxonomy small - around 5–10 named categories - and give each one a clear definition so engineers apply them the same way.
A good starting set includes hallucination, tool_call_malformed, refusal, truncation, timeout, and rate_limit. Store these as low-cardinality labels like app.llm.error_class. You need to separate quality, safety, and ops failures before you can measure any of them.
Some issues can be caught right when the request happens. Others can’t. Refusals, truncations, and malformed tool calls can be detected by checking finish_reason and running a schema parse. Hallucinations are different. They need an automated judge or human review, and then you write the tag back to the original span ID. If a truncation leads to a malformed tool call, tag it as truncation because that’s where the fix starts. Those tags become the labels you score against on live traffic.
Log every request with trace-level production data
Log each request as a trace with nested spans. Include the prompt, output, model, prompt version, user and session IDs, timestamp, latency, token counts, and estimated cost.
You should also log:
-
finish_reason -
temperature -
retrieved document IDs and scores
-
cost.pricing_version
That last field matters more than it may seem. If a provider changes pricing later, your past cost records still stay accurate.
For storage, use tail-based sampling. Capture 100% of traces that hit errors, high latency, or low quality scores, and sample routine successes at a lower rate, around 5–10%. Once those traces are in place, you can score them on their own and send the right cases to review.
Trace multi-step agent runs, not just single completions
Single-completion logging falls apart once agents start making tool calls or retrying steps. Context retention accuracy in agents usually drops by 15–30% in sessions exceeding 10 turns. Without step-level traces, you’re left guessing which turn caused the issue.
Set up traces so each generation span sits under the tool-call span it used. That makes it possible to rebuild the full ReAct loop and see how many iterations happened before things went sideways. Log tool outputs, including empty results, because a database query that returns nothing is not the same as a tool that failed.
This is also where agent-only failure modes show up. Goal drift, where the agent shifts away from the original objective, and retry loops, where it keeps calling the same tool again and again, are only visible at this level. These traces then feed continuous evaluation on live traffic.
Run continuous evaluations on live traffic
Score live traces for quality, grounding, and safety
Once you’ve captured traces, the next move is continuous scoring. Plain monitoring misses a lot of model failures, especially the weird ones that show up in production and nowhere else. A better setup is simple: run low-cost checks on all traffic, then use pricier semantic judges only on traces that are flagged or sampled.
Use LLM-as-a-judge for semantic checks like grounding, relevance, and toxicity. Use deterministic code scorers for structural checks like JSON schema validation and tool argument correctness. In practice, that means deterministic scorers should run on every trace , while semantic judging should be limited to the cases that need it.
That matters because even a small sampling gap adds up fast when failures are rare.
“A 10% sample isn’t a monitoring strategy; it’s a way to miss the failures that matter most.” - Neel Sharma, Sentrial
If your failure rate is 0.3%, a 10% sample means you’re only inspecting 0.03% of actual failures. For rare but severe issues - jailbreaks, deep-chain tool errors, and hallucinations - that gap is hard to accept. If full coverage matters, use lightweight classifiers instead of calling a large LLM judge on every request. They’re fast enough to run at 100% volume without blowing up inference costs.
Send flagged traces into human review queues
Route low-scoring traces, safety triggers, and a small calibration sample to human review. Those reviewed cases then become the next set of regression tests.
Turn production failures into regression evals
Take reviewed failures and turn them into datasets. Then turn those datasets into scorers and register them in CI/CD. If a new prompt version or model update does worse on one of those cases, the deployment gets blocked. Register that same scorer as an online monitoring rule too, so you get alerted if the same pattern shows up again in live traffic after a fix ships.
Latitude groups recurring low-scoring traces into signals and turns actual production failures into evals. That way, your regression suite grows from the issues that are breaking in production, not from made-up test cases.
Pin the judge model and scorer prompt version so scores stay comparable over time.
The next section compares the tools that support this loop.
Set up alerting and incident response for LLM-specific failures
Define SLAs and alert thresholds for quality, latency, and cost
Once you’re scoring live traces, alerts should trigger only when failures cross sustained thresholds. The goal isn’t to page the team for every blip. It’s to act when quality, safety, latency, or cost starts sliding in a way that sticks. That means using live eval scores and failure tags to drive alerts, instead of relying on raw HTTP status codes alone.
You need three signal layers:
-
Operational : latency and error rate
-
Quality : groundedness, relevance, and rubric scores
-
Safety : jailbreaks and PII leaks
Each layer needs its own threshold.
| Metric Category | Specific Metric | Alert Threshold |
|---|---|---|
| Operational | Time to First Token (TTFT) | P50 < 500 ms; P99 < 5 s |
| Operational | Error Rate | > 2% sustained; page at > 5% over 5 min |
| Cost | Cost per request/day | > 2× daily baseline |
| Quality | Groundedness Score | Drop below 0.80 |
| Quality | Score drift | 2–5 point drop in rolling mean over 15–60 min window |
| Safety | Safety eval | Page on any failure |
For agentic systems , set hard cost circuit breakers per session. There’s a painful example of what happens when you don’t: two sub-agents kept asking each other for clarification, with no circuit breaker in place. The issue went unnoticed for 11 days, and weekly API spend jumped from $127 to $47,000.
When an alert fires, trace the failure from retrieval to routing before you roll anything back.
Triage incidents by drilling into traces and recent deploys
Use the trace linked to the alert and work through triage in this order: retrieval, generation, routing, then upstream data. In plain English, check whether the retrieved context was enough, whether the prompt or model changed, whether the wrong tool or route fired, and whether the issue points to a larger data problem.
“A broken endpoint maps to a single commit and a single rollback. A drifting rubric maps to a prompt edit or a quiet model-version push or a RAG re-index.” - Future AGI
If you do need to roll back, use immutable prompt versions. For stateful agents, add a graceful drain so existing sessions finish on the old version while new sessions start on the rollback version. That avoids context corruption, which can turn one incident into a bigger mess.
Standard monitoring vs. observability plus evaluations
The difference between these two setups shows up fast in production.
| Feature | Standard Monitoring (APM) | Observability + Evaluations |
|---|---|---|
| Time to Diagnose | Infrastructure-level only (CPU, 5xx errors) | Trace-level: retrieval vs. generation vs. routing |
| Root-Cause Clarity | High for crashes; blind to behavioral issues | Trace decomposition and quality signals |
| Recurrence Prevention | Integration tests only | Regression evals derived from real production failures |
This only works if alerts, traces, and evals sit in the same stack. Otherwise, teams waste time hopping between dashboards and trying to piece the story together by hand. The next step is picking tooling that can hold traces, scores, and incident context in one workflow.
Choose the right tooling and close the loop
Where LangSmith, Langfuse, Braintrust, Helicone, and Latitude fit
You want tools that line up with each part of the failure loop: capture, score, review, and gate. The key is simple: don’t pick by feature checklist alone. Pick by the gap in your workflow.
Helicone handles request capture and cost controls with a base_url change. That makes it one of the easiest ways to get visibility without reworking your stack. Its request caching can cut API costs by 20%–40% for agents making repeated similar calls.
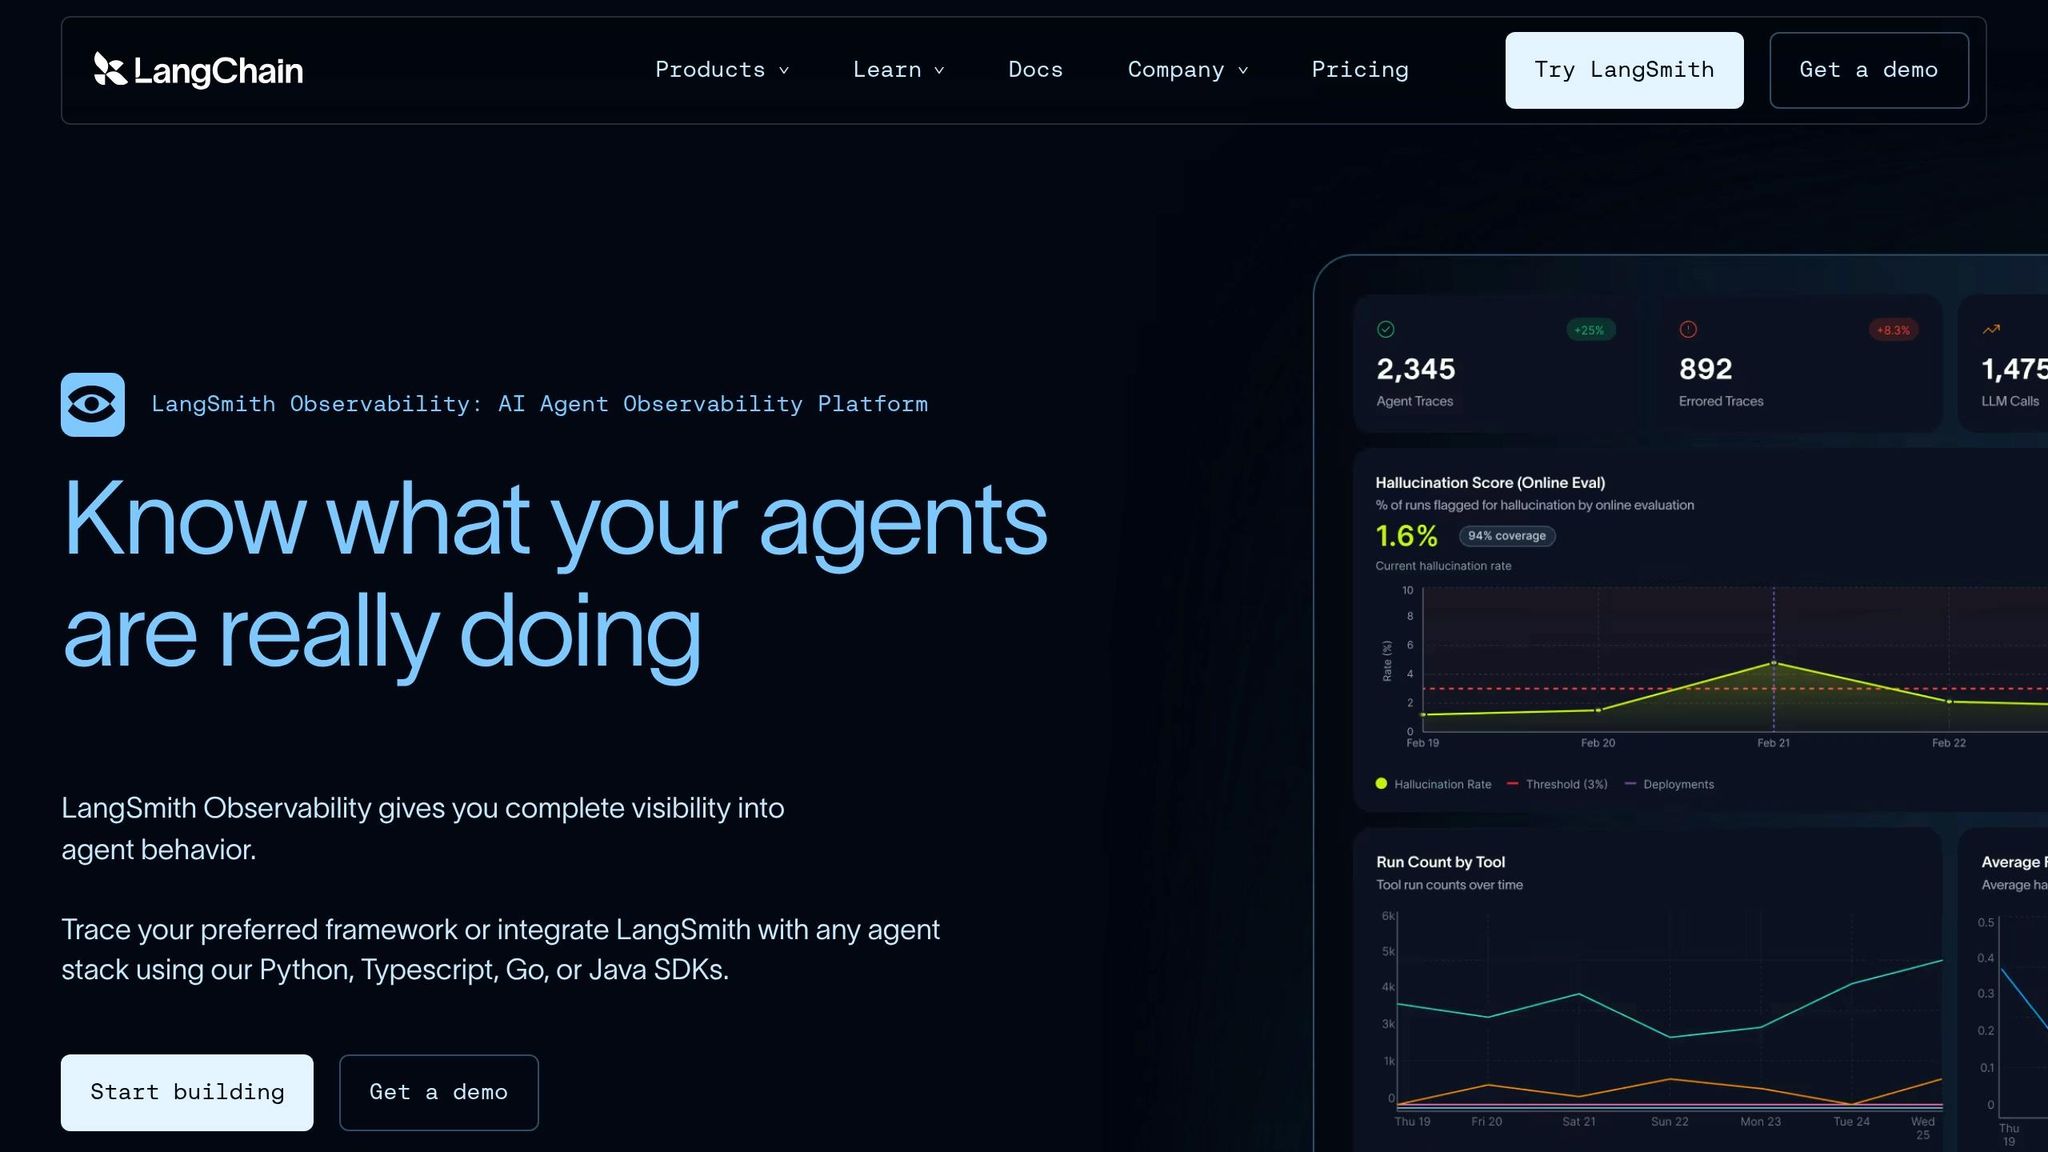
LangSmith makes sense for LangChain and LangGraph teams that need fast trace search across large agent runs. If your team already lives in that ecosystem, it fits the dev loop well.
Langfuse is a good fit for teams that want self-hosted tracing and tighter control over trace data. That matters when data handling rules shape your tool choice.
Braintrust is built for teams that want deployment gates tied to eval results. It blocks deploys when eval scores regress against a golden set, which helps keep bad prompt or model changes out of production.
Latitude is built around turning production failures into reproducible evals. That means regressions can be caught before users feel the pain.
Compare production LLM observability tools
The table below shows where each tool fits in the loop.
| Feature | Latitude | LangSmith | Langfuse | Braintrust | Helicone |
|---|---|---|---|---|---|
| Primary Focus | Failure discovery | LangChain dev loop | Open-source tracing | CI/CD eval-as-code | Gateway/cost proxy |
| Tracing Depth | Native session objects | Deep, LangChain-native traces | Session threading | Manual spans | Request-level proxy |
| Eval Strategy | Auto-generated evals from production issues | Manual / LLM-as-judge | Manual / online sampling | CI/CD regression gates | Replay |
| Human Review | Structured review queues | Review queues | Annotation tags | Manual annotation | Limited |
| Regression Prevention | Auto-test generation | Manual dataset promotion | Manual workflow | Blocking CI checks | Replay and manual review |
| Hosting | Managed | Managed / BYOC | Self-hosted / managed | Managed | Managed / OSS proxy |
A simple way to choose:
-
LangSmith if you’re on the LangChain stack
-
Langfuse if trace-data control is the main issue
-
Braintrust if you need CI/CD deployment gates
-
Helicone if you want a cost and latency baseline fast
-
Latitude if you need failure-mode lifecycle management
Conclusion: a practical workflow for tracking LLM failures in production
Capture traces. Score live traffic. Route failures to review. Alert on regressions. Turn incidents into evals.
That’s the loop.
When traces connect to alerts, alerts connect to evals, and evals connect back to the production traces that created them, debugging stops feeling like guesswork. You can see what broke, why it broke, and how to keep it from happening again.
FAQs
What counts as an LLM failure in production?
An LLM failure in production often shows up as silent degradation. The request goes through. The model answers in smooth, confident language. But the output is wrong, off-tone, or just not useful.
This tends to show up in RAG and tool-calling workflows. You might see hallucinations, prompt injections, or a drop in output quality after a model update. And that’s the tricky part: standard infra alerts usually won’t catch it.
That’s why teams need observability built for LLM behavior, such as Latitude.
How do I monitor quality if responses still return HTTP 200?
Standard monitoring tools can tell you if a system is up. They usually can’t tell you if the answer was any good.
That’s the gap.
A lot of LLM failures hide behind HTTP 200 responses. On paper, the request worked. In practice, the model may have gone off-topic, skipped a step, used weak reasoning, or returned something misleading. If you only watch uptime, latency, and error rates, you’ll miss those problems.
What you need is an LLM observability layer that looks at semantic signals, not just server health.
That means doing a few things well:
-
Trace intermediate steps so you can see how the system got to an answer
-
Log full context and metadata for each interaction
-
Run automated evaluations on every interaction, not just spot checks
This makes debugging much less of a guessing game. Instead of staring at a successful status code and wondering what went wrong, you can inspect the prompt, inputs, tool calls, model path, and output quality in one place.
Tools like Latitude help surface these hidden failures, track them like bugs, and stop the same issues from showing up again.
How can I turn production failures into regression tests?
Capture the full trace for each incident from your observability tool, whether that’s Langfuse, Braintrust, or Latitude. That means the input , the output , and the intermediate steps in between. Then tag the failure with a clear failure mode so you can group similar issues instead of treating each one like a one-off bug.
Next, write a grader that checks for that behavior, not the exact output. That shift matters. LLM failures often show up in patterns, and the wording may change from run to run even when the underlying problem stays the same.
Once the grader is ready, add it to your CI pipeline so deployments get blocked when the same failure pattern shows up again.