
TL;DR
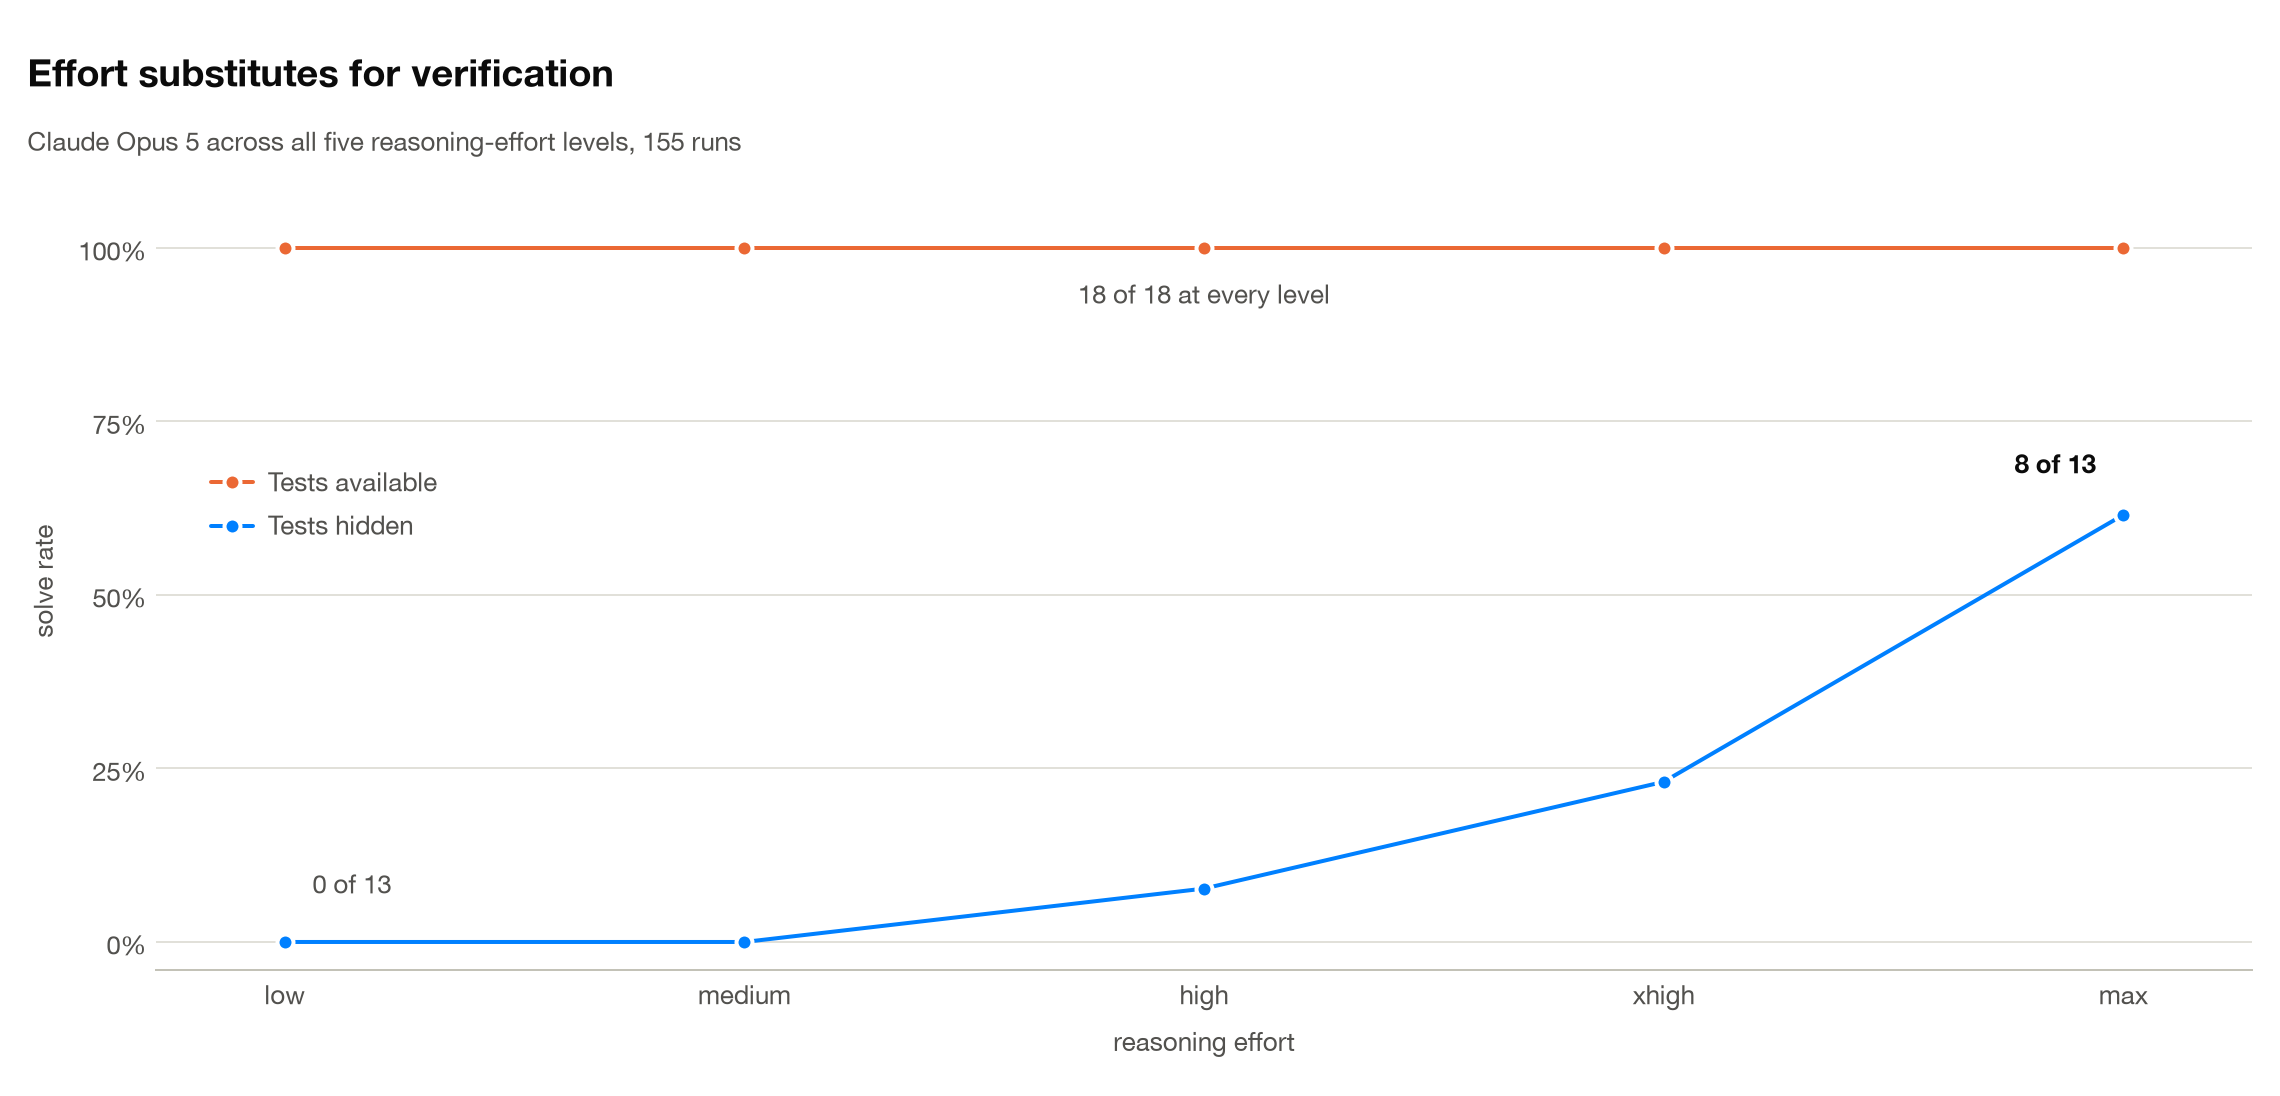
- When the agent could run tests, the effort setting did nothing. All five levels solved 18 out of 18. Going from
lowtomaxcost 1.9x more for the identical result. - When it couldn’t, the effort setting decided the outcome. Solves went 0, 0, 1, 3, 8 out of 13 across
lowtomax(trend p = 1.8 × 10⁻⁵). - I predicted the opposite and published the prediction first. I expected scores to peak mid-dial and drop at the top, which is what the Reddit post implied. They rose instead.
- The failing runs aren’t confused, they’re over-eager. They diagnose the bug correctly, then rewrite a file nobody asked them to touch and break a contract they never saw.
- So the useful knob usually isn’t effort. If your agent can run tests, turn the dial down and keep the money. If it can’t, giving it a way to check its own work beats paying for more reasoning.
Someone posted this to r/artificial last week and it went around a fair bit.
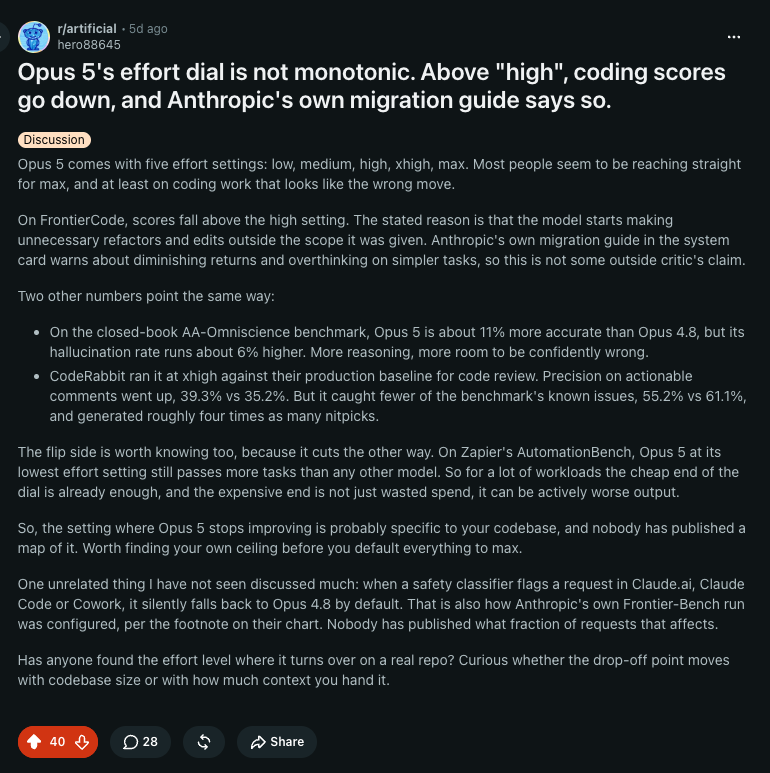
The claim is that Opus 5 gets worse at coding above the high effort setting. It’s a better post than that summary makes it sound. It isn’t one benchmark and a hunch, it cites four things: FrontierCode scores dropping above high, Anthropic’s own migration notes warning about overthinking on simpler tasks, a CodeRabbit run where xhigh got more precise but caught fewer of the issues the benchmark already knew about, and Zapier’s AutomationBench, where Opus 5 at its lowest setting passes more tasks than any other model. It also doesn’t overreach at the end. It says the turnover point probably depends on your codebase and nobody has published a map of it.
I went and checked the four numbers. Three hold up, and the AA-Omniscience one doesn’t. The post puts Opus 5’s hallucination rate about 6% above Opus 4.8, but the published rates are 35.9% and 50.1%. That’s a 14 point gap, and it comes with roughly 7 points more accuracy. The effect is real and quite a bit bigger than advertised, which matters if the small number was what made you comfortable.
The FrontierCode gap goes the other way. 44.4% at xhigh against 43.3% at max is 1.1 points on a single run of one suite, which is noise. The reason to care isn’t the gap, it’s the mechanism the benchmark’s own developer gave for it: max made unsolicited refactors and the harness scored those as errors. That’s a claim about behavior rather than capability, and it’s checkable.
Then there’s the question at the bottom of the post. Has anyone found the effort level where it turns over on a real repo? As far as I could tell, no. So I ran it.
I wrote my predictions down first and published them, mostly so I couldn’t quietly move the goalposts afterward. Then I swept all five effort levels through our coding-agent benchmark. 155 runs, $26.79.
I predicted scores would peak in the middle and drop off at the top. That isn’t what happened. Effort turned out to be irrelevant in one setup and decisive in another, and the thing that flips it has nothing to do with the model.
The setup
Every bug gets run two ways.
The first way, the agent gets the failing test suite and a run_tests tool. It can try a fix, watch it fail, and go again. Six multi-file bug-fix tasks, three trials each, so 18 runs per effort level.
The second way, I delete the test files out of the workspace and take run_tests away. The agent gets a bug report and the source, nothing else. It has to commit to a fix it can’t run. Afterward I score it against the real suite, which it never saw. 13 trials per effort level, one task.
That task is a once() wrapper that fires twice if the handler it wraps emits the same event again. The correct fix is a five-line guard in once.js. The tempting wrong fix is to rewrite the event bus so it stops dispatching from a snapshot it took before calling handlers.
Using one task is a real weakness and worth saying up front. I use it because it’s the only task in the set that has ever split models apart. Everything else gets solved by everything. So read the blind numbers as being about this bug, not about bugs in general.
What happened
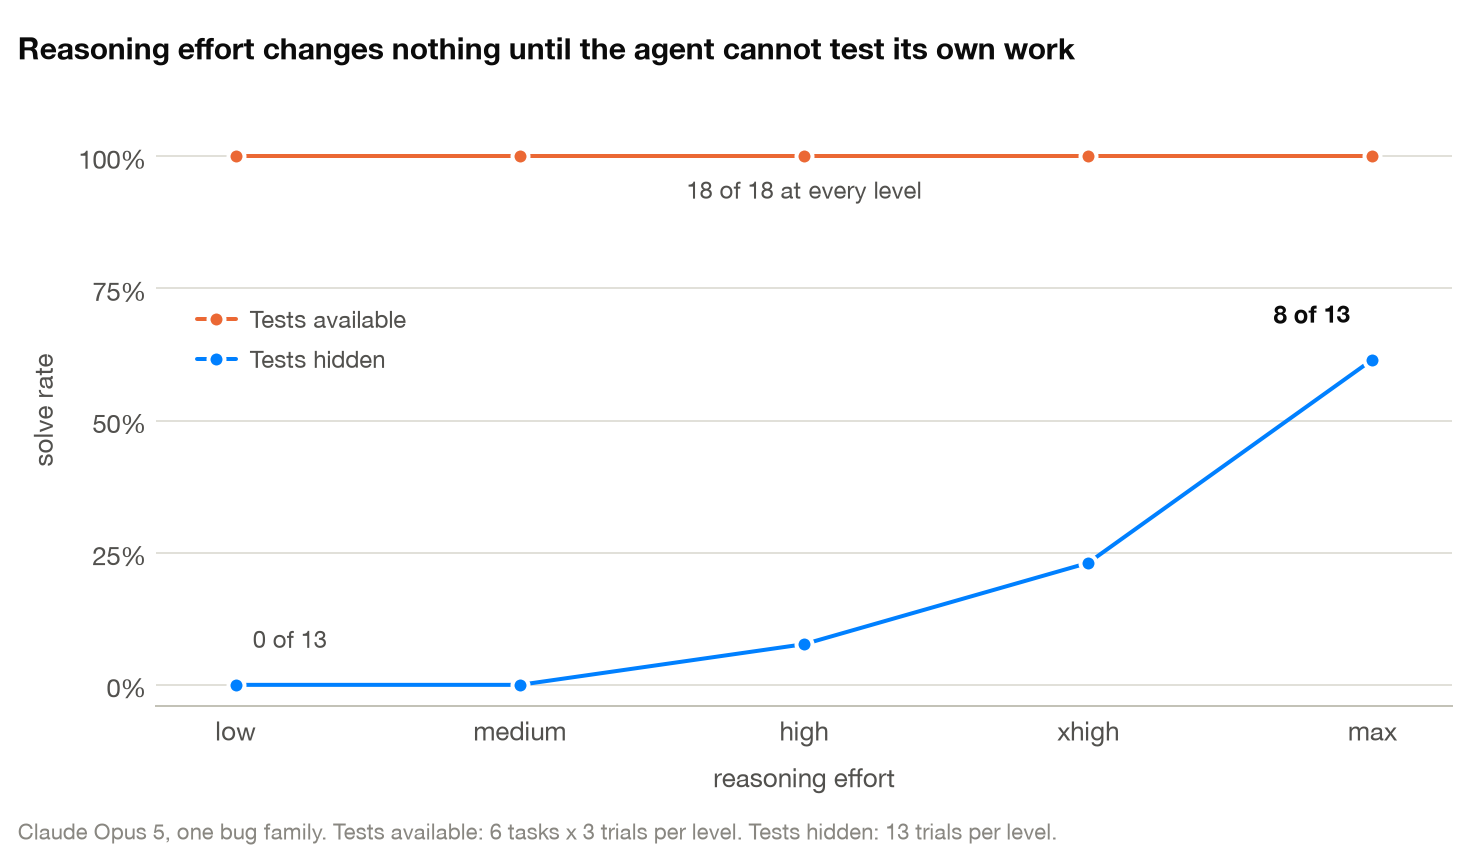
With tests available, every effort level went 18 for 18. Low, medium, high, xhigh and max, all perfect, no separation anywhere.
With tests hidden, same model, same bug:
| effort | solved |
|---|---|
| low | 0/13 |
| medium | 0/13 |
| high | 1/13 |
| xhigh | 3/13 |
| max | 8/13 |
The trend across levels is significant (Cochran-Armitage z = 4.295, p = 1.8 × 10⁻⁵), and low against max is significant on its own (Fisher exact, two-tailed, p = 0.0017).
No two adjacent levels separate, though. xhigh against max comes out at p = 0.11, so I can’t tell you max beats the setting below it. What I can tell you is that the bottom of the dial never solved this bug and the top of it usually did.
Nothing went sideways mechanically, in case you’re wondering whether the blind runs just fell over. Across all 155: no tamper flags, no tool errors, no malformed tool calls, nothing truncated.
Why the failures fail
I read the traces on all 65 blind runs expecting to find confusion. It isn’t there.
The failing runs diagnose the re-entrancy correctly, and in detail. Then they go and rewrite bus.js. They thread a removed flag through subscribe, emit and clear, and along the way they change what emit returns. The hidden suite happens to test that return value. So a run that describes the bug perfectly fails on a contract it had no way of knowing about.
The max runs that succeeded do something narrower. They go back and reread once.js, add the guard, and leave the bus alone. One of them spelled out why: the snapshot-then-call dispatch looks like a bug but is deliberate, and changing it would move behavior nobody complained about.
So the FrontierCode developer’s mechanism is real. Scope discipline is exactly what separates these runs. But in our harness, more effort produced more of it rather than less.
My guess is that it comes down to one line in our prompt: “Change as little as possible; unrelated edits risk failing the hidden suite.” If effort mainly amplifies instruction-following, then the dial helps when the prompt carries a scope constraint and hurts when it doesn’t. That would let both results be true without either being wrong. I haven’t tested it. It’s about a $7 run and it’s next on the list.
There is an overthinking effect in here, incidentally. It just hides inside max instead of showing up in the curve. Of the max runs, the ones that failed spent more output tokens than the ones that worked, median 10,535 against 8,282. The biggest spender of the whole set burned 21,271 tokens over 623 seconds and got it wrong.
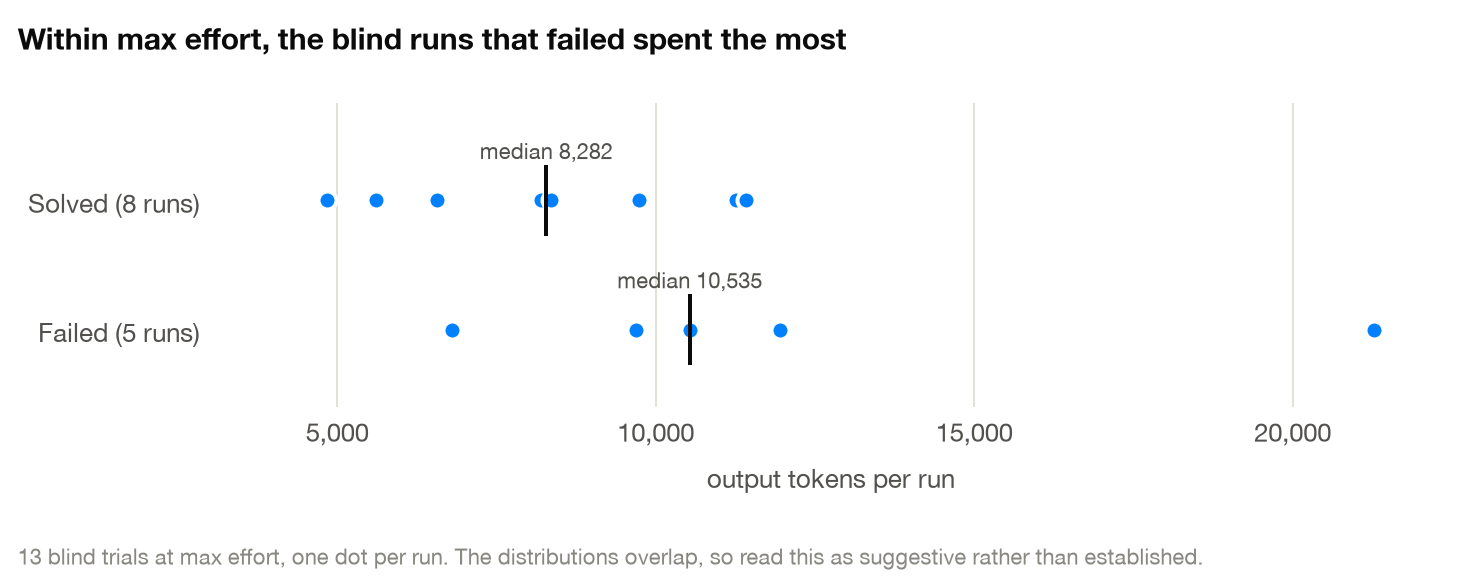
With 13 runs and distributions that overlap this much, that’s a hint rather than a result. I’m flagging it because it’s the version of the Reddit claim that survives. Token spend tracks failure, the effort setting doesn’t, and those two aren’t the same knob.
What it costs
Here’s the tier where effort changed nothing about the outcome:
| effort | solved | cost per solve |
|---|---|---|
| low | 18/18 | $0.1270 |
| max | 18/18 | $0.2416 |
Same result, 1.9x the price, and median runtime went from 22 seconds to 50 seconds. On the blind tier the same dial runs from $0.075 to $0.386 per attempt, and 25 seconds to 131 seconds.
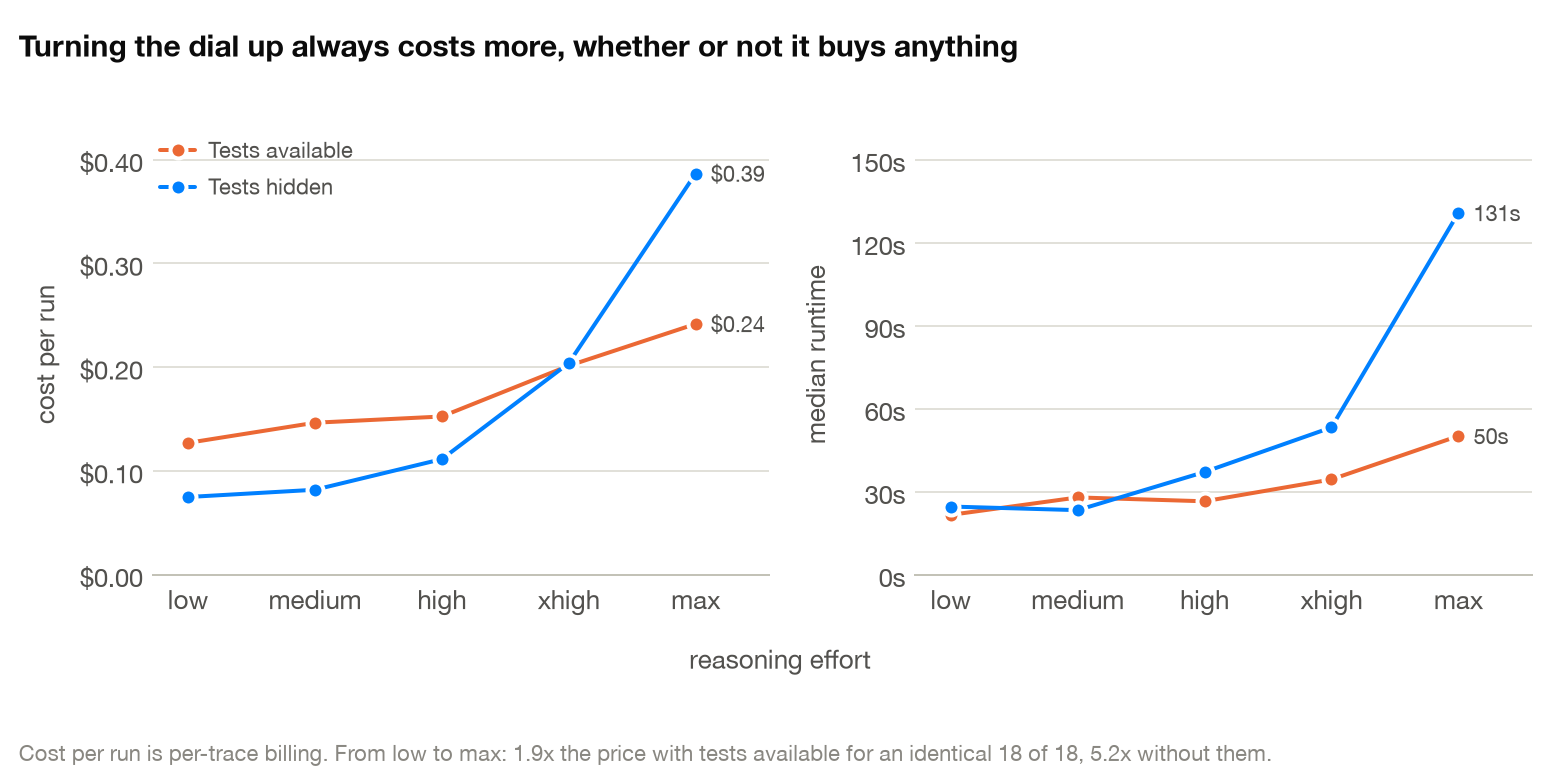
Stack those two tiers next to each other and effort and verification are doing the same job. The model can reason its way to a fix it can’t test, or it can guess cheaply and let a test loop catch the mistake. If you’ve given it the loop, the expensive path buys you nothing and you should turn the dial down. If you haven’t, the dial is the only instrument you’ve got left, and 5x the latency for 8 out of 13 is a bad deal.
That’s my answer to the question the post ended on, for one harness at least. The dial never turned over. There’s no setting where Opus 5 got worse at these tasks. There’s a setup where the setting stopped mattering and a setup where it decided everything. If you’re hunting for your own turnover point, the first thing to change isn’t the effort level, it’s whether your agent can tell when it failed.
That’s also where this stops being about Opus 5. A lot of production agents are blind in exactly this sense, not because there’s no test suite anywhere, but because nothing in the loop tells the agent whether the thing it just did actually worked. Turning up effort is the expensive way to paper over that.
Reproducing it
The harness, tasks and raw results are public. Read the pre-registration before the results if you like, the prediction I got wrong is still sitting there in the words I originally wrote it in.
The cost numbers come from per-trace billing rather than multiplying tokens by a price list.
One gotcha if you run this yourself. Opus 5 has thinking on by default, which Opus 4.8 did not, and thinking comes out of the same output budget as the answer. My first max run hit the ceiling and stopped on length. If I’d let that through as a data point it would have looked like a reasoning failure, and the curve would have pointed the other way.