
Traditional application performance monitoring tells you whether software executed successfully. LLM observability tells you whether a probabilistic system behaved correctly. A request can return HTTP 200 in 800 milliseconds while the agent cites unsupported facts, calls the wrong tool, or tells the user that an action succeeded when nothing changed.
Keep APM for infrastructure health. Add session-level agent traces and quality checks for behavior. The two systems answer different parts of the same incident.
How do APM and LLM observability differ?
Google’s Site Reliability Engineering book defines the four golden monitoring signals as latency, traffic, errors, and saturation (Google SRE). Those signals remain essential. They can show a slow model gateway, a saturated worker, or a spike in 500 responses.
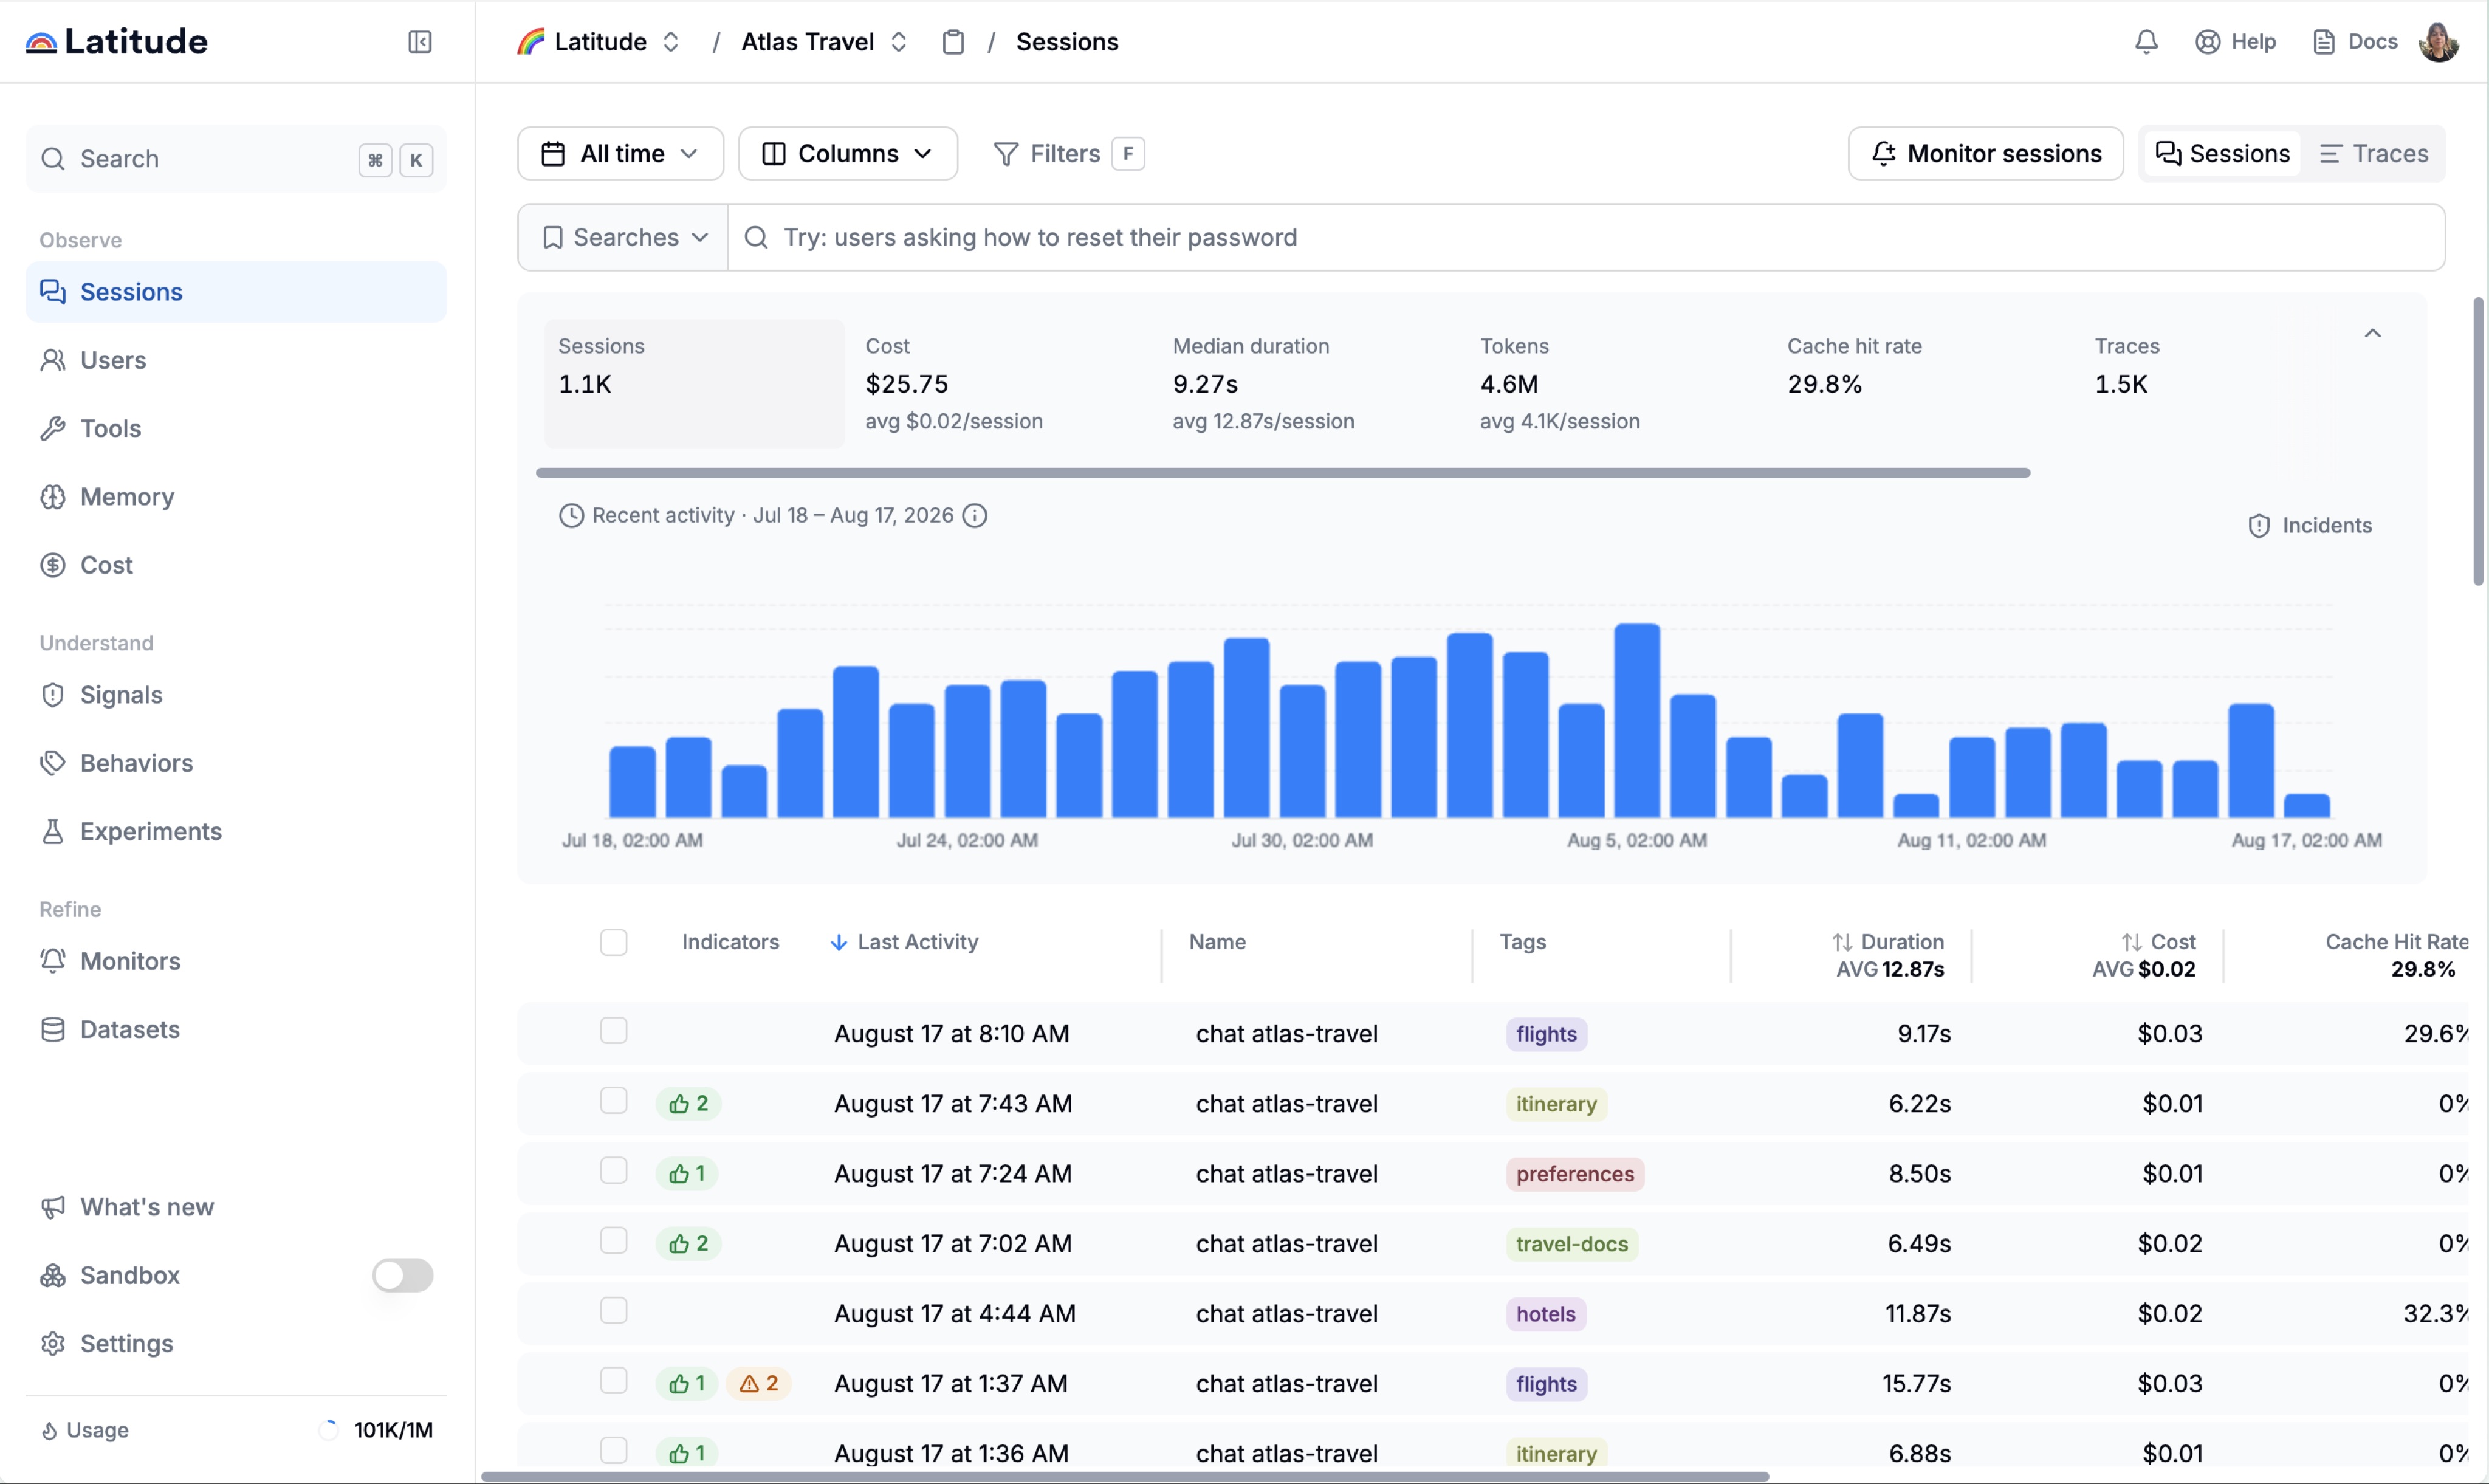
LLM observability adds evidence about meaning and decisions. It records the conversation, model and prompt versions, retrieved documents, tool arguments and results, and quality scores. The OpenTelemetry GenAI attribute registry now defines fields for each of these.
| Question | Traditional APM | LLM observability | Unit of analysis | Example alert | Response workflow |
|---|---|---|---|---|---|
| Did the service run? | HTTP status, latency, throughput, saturation | Preserves these signals | Request or service | Error rate above 2% | Inspect service and dependency spans |
| Did the model respond? | Request completion | Generation status, finish reason, model, tokens | Generation | Empty response detected | Inspect model span and payload |
| Did the agent answer correctly? | Usually invisible | Groundedness, relevance, task outcome | Trace or session | Unsupported-answer rate increased | Review examples and evaluator criteria |
| Did it use the right context? | Dependency call may look healthy | Retrieved document IDs, scores, content | Retrieval span | Correct source absent from retrieved set | Inspect query, filters, index, reranker |
| Did it take the right action? | Tool endpoint returned 200 | Tool choice, arguments, result, final claim | Tool span plus session | Agent reports success without state change | Compare transcript with environment outcome |
| Is the issue recurring? | Grouping by exception or endpoint | Semantic failure group, affected sessions, trend | Named failure pattern | Failure pattern is escalating | Verify examples, create regression coverage, track after fix |
What can a healthy HTTP 200 still hide?
A technically successful request can contain any of these product failures:
- An unsupported answer that reads confidently.
- A retrieval step that selected irrelevant or stale documents.
- A correct tool called with the wrong arguments.
- A tool response interpreted as success even though the requested state did not change.
- A loop that repeats calls without making progress.
- Instruction drift after a prompt, model, or release change.
The final item matters because LLM output varies even when the surrounding application is stable. APM can confirm that every component returned on time. It cannot decide whether the answer followed policy or solved the user’s task.
Anthropic makes the same distinction through outcomes and transcripts. A flight-booking agent can say that a reservation was created while the database has no reservation. The transcript records what the agent did, and the environment outcome determines whether it succeeded (Anthropic).
What fields does an agent trace need?
OpenTelemetry defines a trace as the path of a request through an application (OpenTelemetry). Agent debugging needs that path plus the context that explains each probabilistic decision.
A useful hierarchy looks like this:
Session
  conversation_id, user_id, environment, release, feedback

  Trace
    trace_id, task, start/end time, total cost, final outcome

    Span
      operation, parent/child order, duration, error status
      prompt name/version, request model, response model
      retrieval query, document IDs and scores
      tool name, arguments, result

      Generation
        input messages, system instructions, output messages
        finish reason, input/output tokens, evaluator scores
The OpenTelemetry registry warns that input messages, output messages, and tool payloads can contain sensitive or personally identifiable information. Capture policy therefore needs field filtering, redaction, access control, and retention rules alongside instrumentation.
How does quality become measurable?
Use the cheapest reliable check for each failure definition. Reserve model-based evaluation for behavior that cannot be expressed cleanly in code.
| Check | Coverage | Latency and cost | Best use | Main limitation |
|---|---|---|---|---|
| Deterministic rule | Broad or complete eligible traffic | Low | Empty output, schema failure, forbidden argument, state mismatch | Misses semantic nuance |
| Semantic search or grouping | All captured traffic where embeddings are available | Moderate indexing cost | Find similar intents or outcomes across varied wording | Similarity does not prove a shared root cause |
| LLM judge | Sampled or targeted traffic | Model latency and token cost | Groundedness, policy adherence, conversation quality | Needs human calibration and has variable output |
| Human review | Small selected set | Slow and expensive | High-stakes cases and judge calibration | Cannot cover production volume |
At Latitude, trace ingestion captures 100% of traffic. Deterministic flaggers run on eligible completed traces, while LLM-based flaggers use a 10% default sample that can be increased. This split keeps rare structured failures visible without paying for a judge on every conversation.
Semantic search follows a different path. Messages are embedded when written, and queries use cosine similarity over captured traffic. That allows a team to search for a behavior such as a polite false-success response even when no shared error string exists.
How should APM and LLM observability work together?
Use one incident workflow with two evidence layers:
- APM detects service symptoms such as latency, errors, or saturation.
- Agent traces reveal which sessions and steps were affected.
- Quality checks show whether technically healthy sessions also failed semantically.
- Release, model, prompt, cohort, and tool metadata narrow the change or dependency involved.
- Representative traces become regression cases.
- Infrastructure and behavior trends verify the fix after release.
This joined workflow prevents two common mistakes. The first is debugging an answer-quality issue by tuning infrastructure. The second is treating a provider timeout as a prompt problem.
What does a silent failure look like from detection to verification?
Latitude models a recurring failure as a Signal with examples, occurrences, affected-session share, trend, and lifecycle. A saved search can find new matching traffic. A Signal keeps the problem’s evidence and history together. As Gerard from Latitude’s engineering team puts it, a Signal is “the only one that can track that signal over a large data corpus and long time horizon.”
A verified internal regression-proof artifact shows one tool-call Signal falling from 8 occurrences to 3, then 2, then 0 after a fix. The useful part is the sequence:
- Inspect the full sessions behind the pattern.
- Confirm the tool payload or outcome that defines the failure.
- Preserve representative traces as regression coverage.
- Send the evidence to the team’s repository-aware coding agent.
- The coding agent writes the smallest fix, adds a test, and opens a PR.
- A human reviews and merges the PR.
- The Signal trend verifies whether the failure declines in production.
Latitude provides the telemetry, diagnosis, handoff, and verification. The coding agent changes the repository. This boundary keeps the production evidence attached to the work while preserving human control over merge and deployment.
What is the minimum adoption plan for a team with APM?
Start with one failure that users care about:
- Keep the existing APM stack and trace IDs.
- Capture complete agent sessions with model, prompt, retrieval, and tool context.
- Link traces to environment and release metadata.
- Define one observable quality failure with positive and negative examples.
- Run deterministic checks broadly and calibrate any semantic judge on reviewed examples.
- Trend the failure rate and affected sessions.
- Promote verified failures into regression coverage.
This is enough to answer whether the application stayed healthy and whether the agent still did its job.
Frequently asked questions
Does LLM observability replace Datadog, Sentry, or New Relic?
No. Existing APM remains the right system for infrastructure health, service dependencies, latency, errors, and saturation. LLM observability adds conversation, model, retrieval, tool, outcome, and quality context. Correlate them through trace IDs, releases, and environments.
What is a semantic failure?
A semantic failure occurs when the system executes but the meaning or outcome is wrong. Examples include an unsupported answer, a policy violation, an irrelevant retrieval result, or a false claim that an action succeeded.
Do I need to store every prompt and response?
You need enough trace context to reproduce and explain failures. Sensitive deployments may redact fields, retain payloads for shorter periods, or keep metadata while restricting content access. OpenTelemetry explicitly warns that message content may contain PII.
Must an LLM judge score every trace?
No. Use deterministic checks wherever the failure has a stable machine-readable signature. Apply LLM judges to sampled or targeted traffic, and calibrate them against human review.
How does a production failure become a regression test?
Save a representative trace, define the expected outcome or forbidden behavior, and add a deterministic assertion or calibrated evaluator. Run it before releases, then monitor the same failure definition in production.