
Most LLM feedback loops fail for one simple reason: they collect signals, but not enough context to use them.
If I had to sum up the article in a few lines, it’s this:
-
Raw metrics like latency, uptime, and token use show system health, not answer quality.
-
User feedback is thin , with explicit response rates often around 1% to 3%.
-
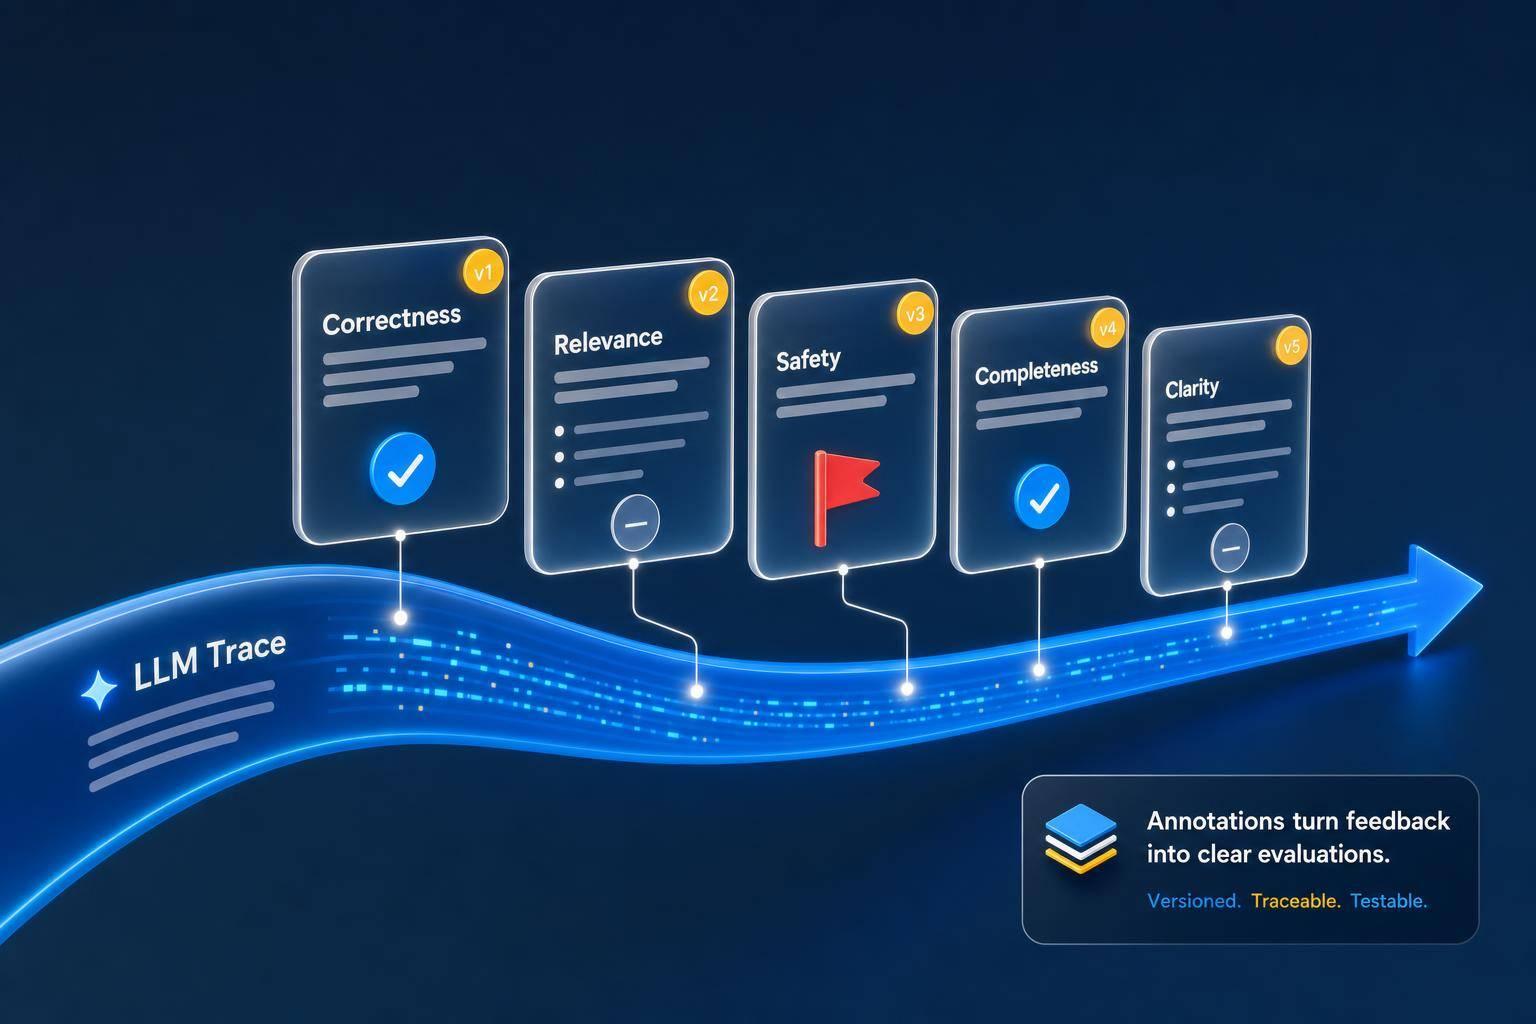
Annotations turn weak signals into labeled data by tying feedback to the exact trace, prompt version, and model run.
-
Human review still matters for tone, policy, and multi-step failures that automated judges often miss.
-
A small, fixed schema helps teams turn production failures into repeatable evals and regression tests.
In other words: a thumbs-down alone doesn’t tell me much. But a thumbs-down linked to a trace, a failure label, a reviewer note, and a corrected output gives me something I can test, compare, and fix.
Here’s the short version of what matters most:
-
Keep annotations simple: score, label, note, source, and scope
-
Start with binary labels
-
Review 30–50 traces before adding more failure categories
-
Use 100–200 human-labeled traces to tune automated evaluators
-
Treat schema changes like code, with versioning and checks
A lot of teams think they have a feedback loop because they log errors and collect ratings. I’d say that’s only the start. The part that makes feedback useful is the layer that connects each complaint or review to what the model actually did.
Quick Comparison
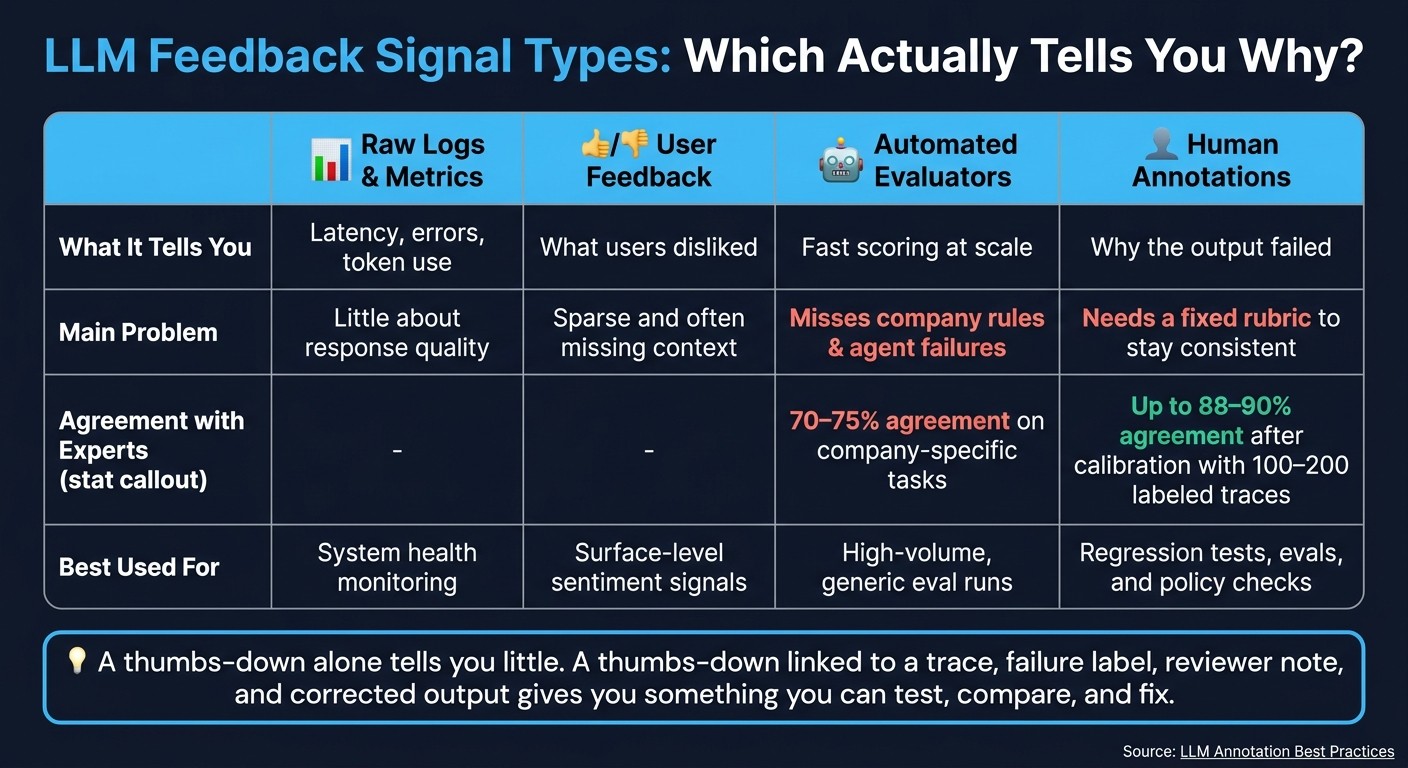
| Signal type | What it tells me | Main problem |
|---|---|---|
| Raw logs | Latency, errors, token use | Little about response quality |
| User feedback | What users disliked | Sparse and often missing context |
| Automated evaluators | Fast scoring at scale | Can miss company rules and agent failures |
| Human annotations | Why the output failed | Needs a fixed rubric to stay consistent |
That’s the core idea behind the article: annotations make LLM feedback measurable, searchable, and usable for evals.
How Annotations Turn Feedback Into Measurable Signals
Annotations connect each user signal to the exact trace, span, and prompt version that produced it. That direct link makes quality measurable across runs.
But there’s a catch: this only works when the annotation schema stays consistent.
What a Trace Annotation Contains
A useful annotation should include score , label , explanation , source , scope , and metadata.
| Field | Description | Example Values |
|---|---|---|
| Score | Numeric quality measure | 0.0 to 1.0 |
| Label | Categorical classification | pass, fail, hallucination |
| Explanation | Reviewer’s reasoning | “Agent missed the shipping delay context” |
| Source | Who provided the feedback | reviewer, end user, automated evaluator |
| Scope | What part of the interaction is labeled | Trace, Span, or Text Range |
| Metadata | Trend context | Model version, timestamp, product area |
The explanation field matters most. It tells you why the score changed, not just that it changed.
Taken together, these fields let teams route reviews and compare them in a consistent way.
How Annotation Queues Organize Review
Reviewing traces by hand doesn’t scale. Annotation queues fix that by sending traces to the right reviewers based on automated triggers. A trace might land in a queue because it got a thumbs-down, scored below a set threshold, or went over a latency limit.
Queues also give reviewers the full picture: the system prompt, conversation history, retrieved documents, and tool calls, not just the final response. That extra context matters a lot. It helps a reviewer tell the difference between a hallucination and a reasonable inference, or between a tone issue and a plain accuracy failure.
Queued reviews turn scattered feedback into labeled examples that teams can analyze.
Normalizing Multiple Feedback Sources Into One Dataset
The harder part is that feedback almost never comes through just one channel. You may have thumbs-down ratings from the app, escalations from your support team, and QA reviews from an internal eval team, all pointing to the same kind of failure but using different formats.
Annotations solve that by mapping each source into one shared schema tied to a trace_id. A support ticket can become a severity: high + category: accuracy annotation. A QA reviewer’s notes can become a numeric score plus a label like hallucination. A user’s thumbs-down can become a score: 0.0 / label: fail annotation.
Once everything uses the same schema, you can compare failure patterns across model versions, product areas, and user segments.
With normalized annotations, the next step is to compare them against raw logs and automated scores.
Why Annotations Outperform Raw Logs or Automated Scores Alone
LLM Feedback Signal Types: Logs vs. Annotations Compared
Raw logs and metrics miss the failures that often hurt the most: tone drift, hallucinations, off-topic answers, and incomplete reasoning. LLM apps can look fine in telemetry while still giving users bad outputs. In plain English, they often fail quietly.
Limits of Logs, Complaints, and Automated Evaluators
The problem isn’t that these signals have no use. It’s that none of them gives you the whole picture by itself.
-
Raw logs & metrics: telemetry only
-
User feedback: noisy, context-poor
-
Automated evaluators: scalable, but generic
-
Human annotations: domain-specific and actionable
LLM judges can show position bias, length bias, and self-preference. They also miss company-specific rules and multi-step agent failures. That matters more than it may seem. A system can score well in a generic eval and still break the rules that your team actually cares about.
Generic judges typically agree with subject-matter experts only 70% to 75% of the time on company-specific tasks, but calibrating against a small human-labeled dataset can raise that agreement to 88% or 90%. And you usually don’t need a massive labeled set to get there. A focused batch of 100 to 200 human-annotated traces is often enough to improve automated evaluator accuracy.
Where Human Annotation Still Adds Value
That gap is why human review still matters, especially for policy, tone, and multi-step failures. If you want labels people can trust, the rubric can’t live as a vague doc in someone’s head. It needs to work like a versioned guide, with positive and negative examples, so reviewers label the same failure in the same way.
That consistency is what makes annotated traces useful for regression detection instead of just one-off review. Once the labels line up, teams can turn them into repeatable review workflows.
Annotation Workflows in LLM Observability Platforms
Once you have a consistent labeling rubric, the next step is practical: which platform can take a production trace, send it to human review, and turn that review into evals?
That’s the core workflow. And in practice, not every tool handles the full loop.
Latitude: Annotation Queues Tied to Production Failures
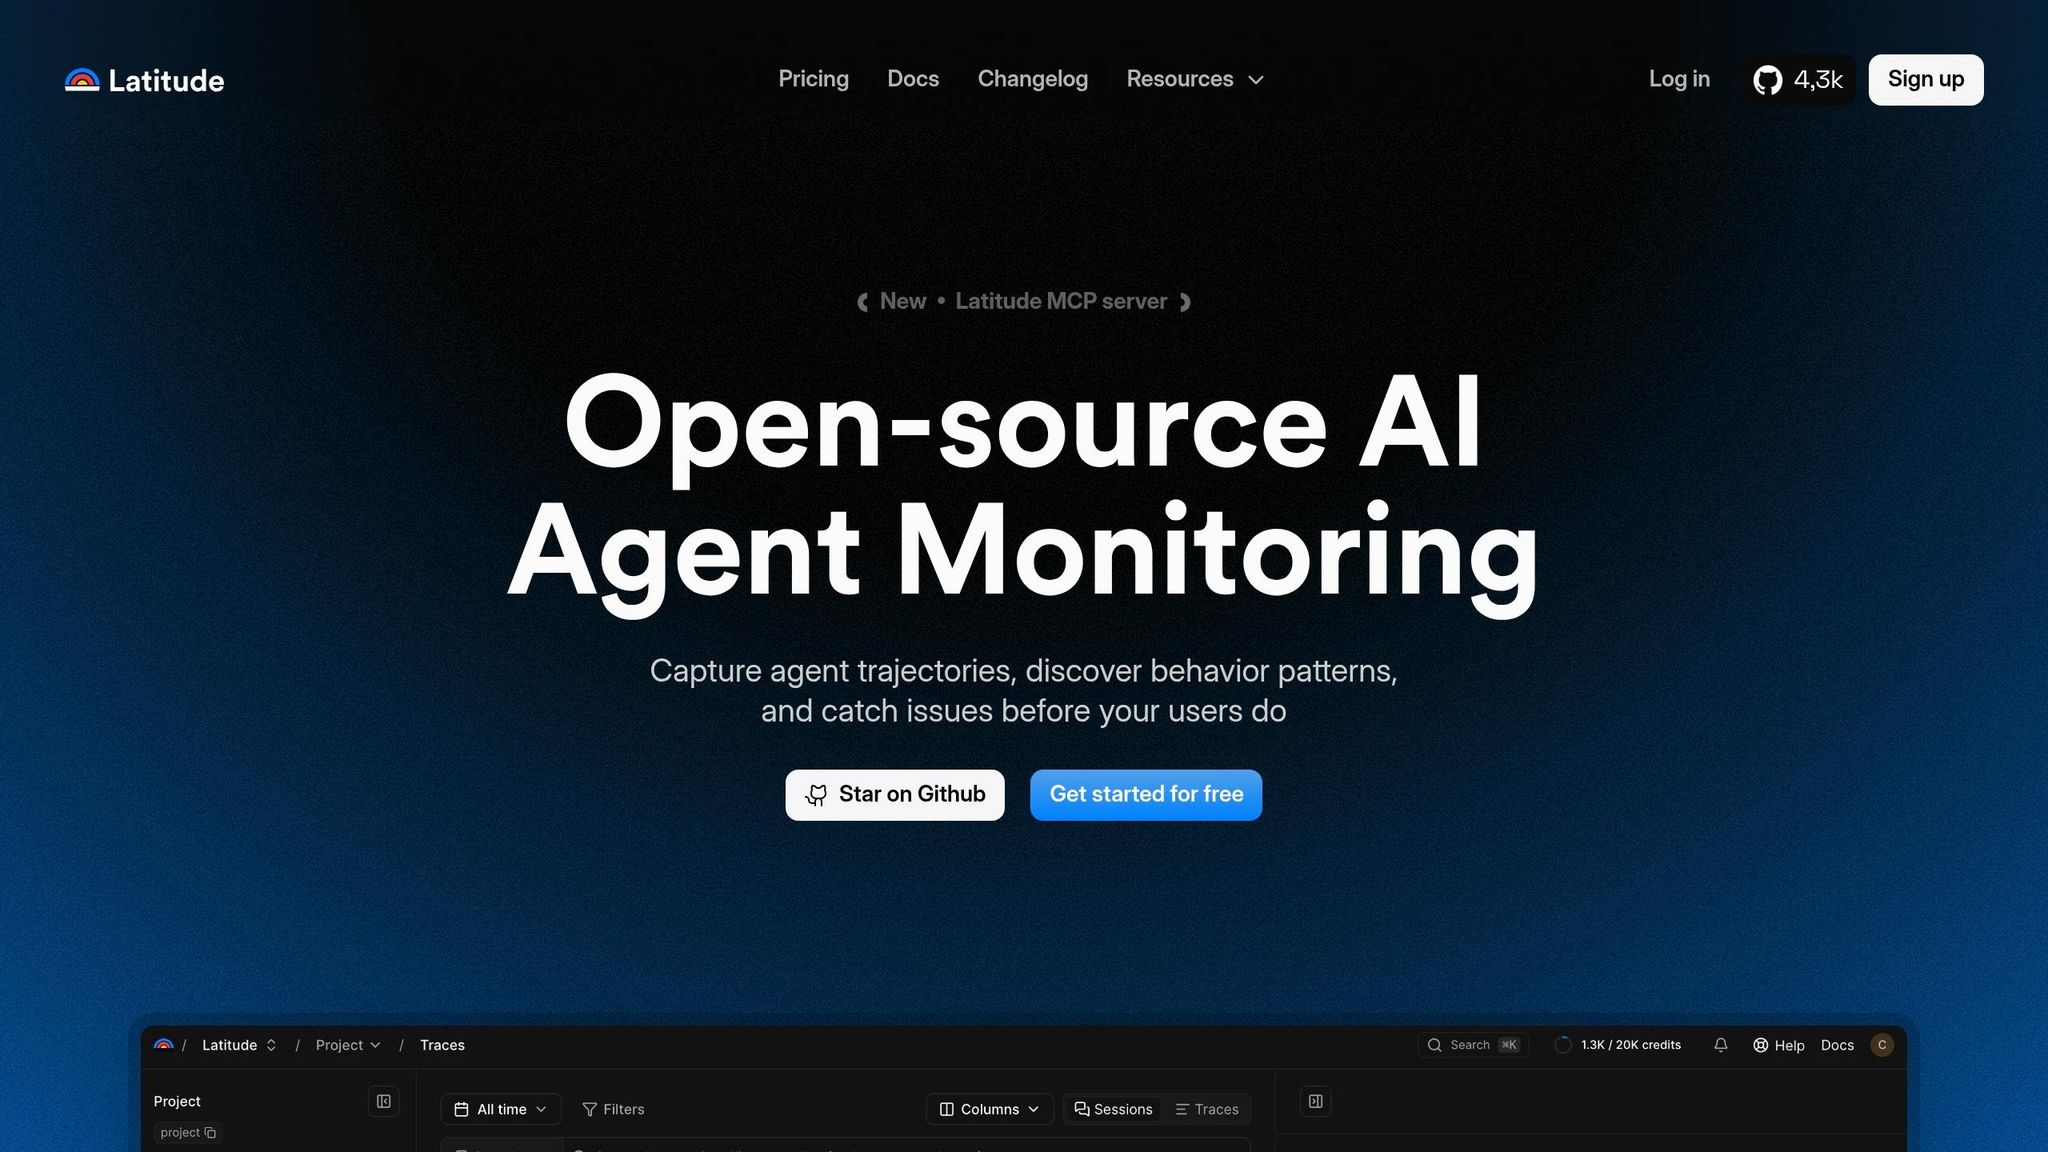
Latitude automatically surfaces production failures and sends them into annotation queues for human review. Reviewers apply labels tied to failure categories, and those labeled traces then feed regression tests through Latitude’s GEPA-based eval generation.
LangSmith, Langfuse, Helicone, and Braintrust: How They Compare
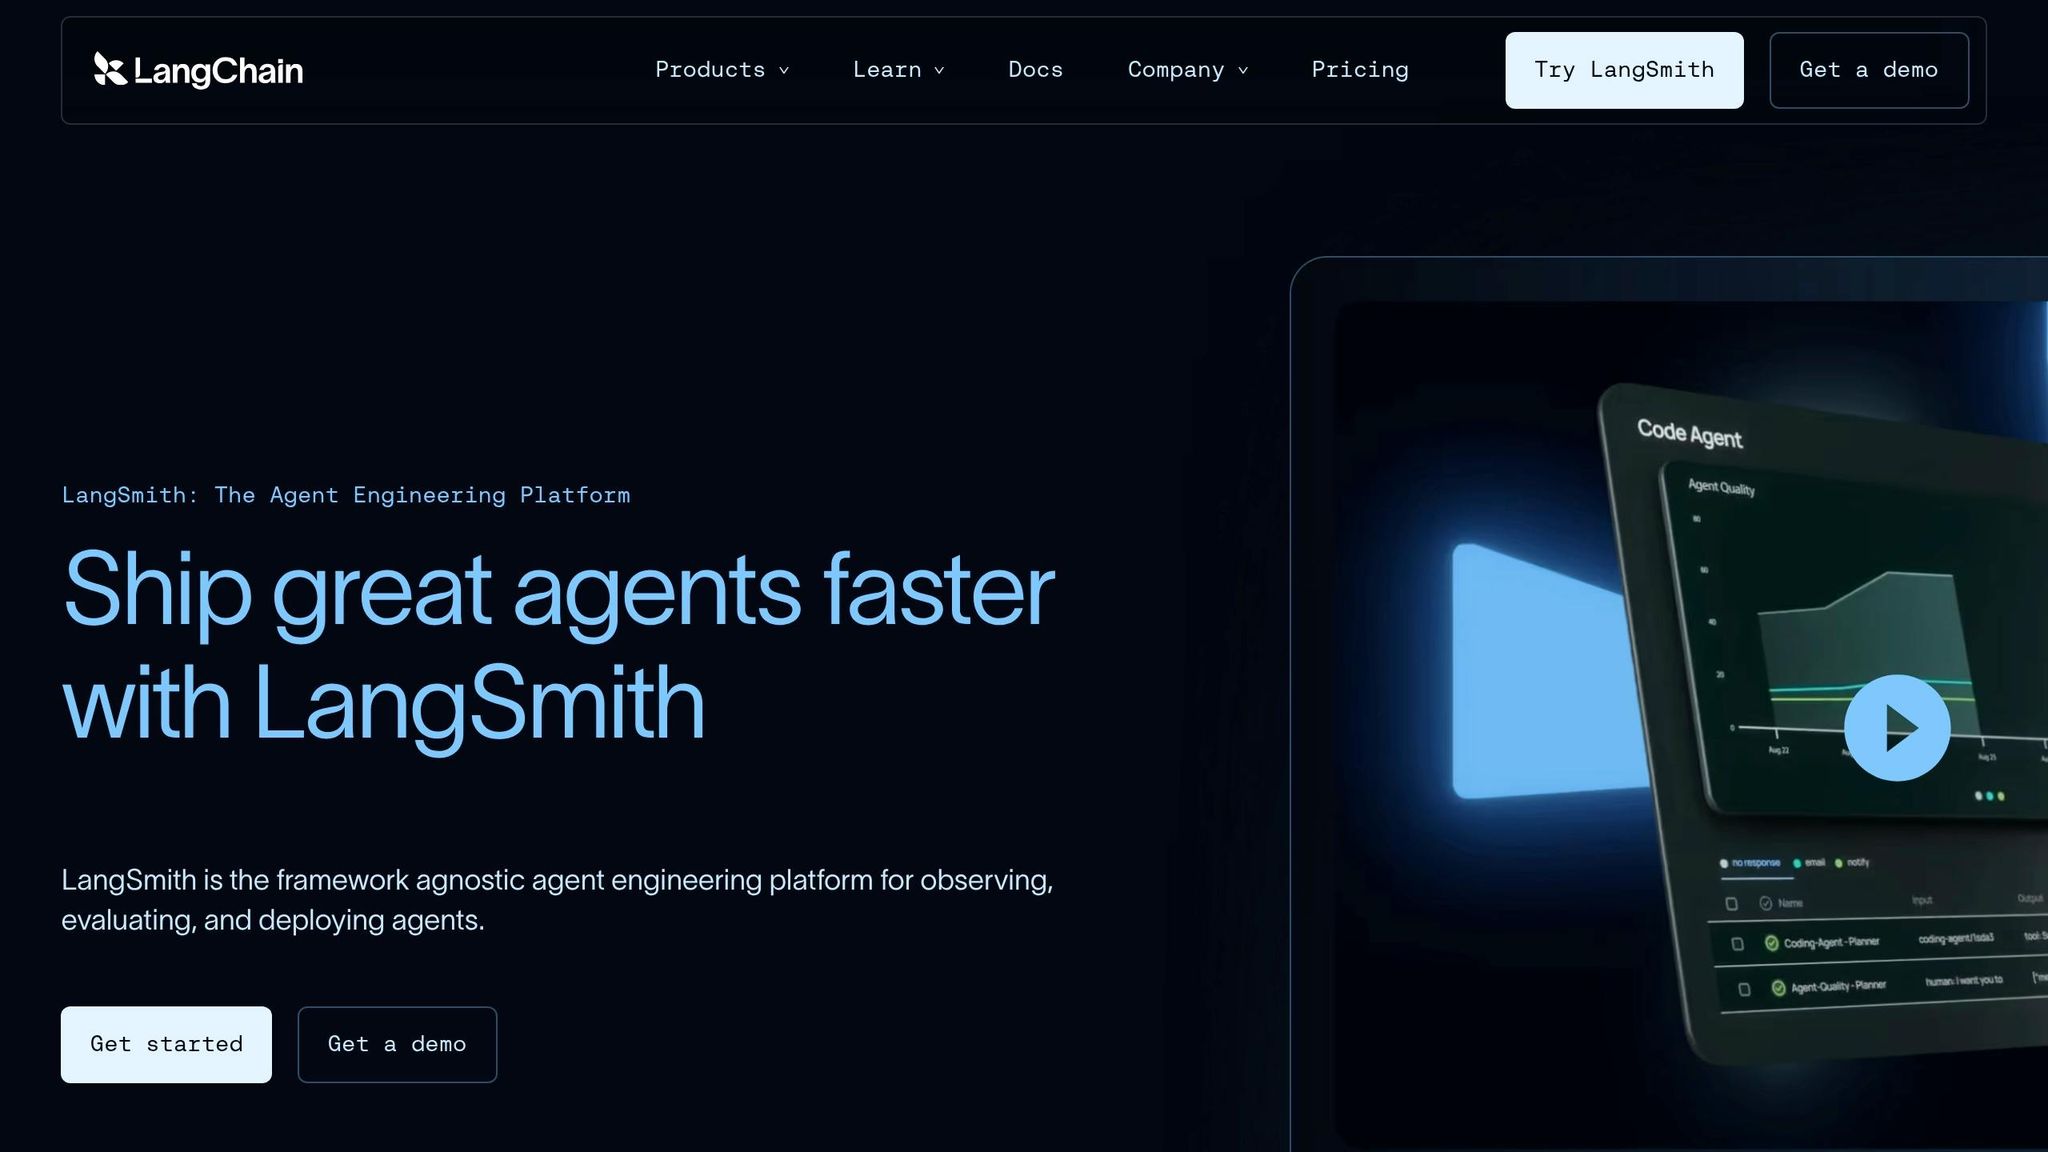
LangSmith supports single-run queues and pairwise queues for side-by-side model comparisons. It also includes automation rules that send low-scored or error-flagged runs straight into review.
Langfuse lets teams set up configurable annotation fields - boolean, categorical, or free text - so reviewers can apply labels the same way across sessions.
Braintrust is built more around evals than reviewer queues. It uses tags, comments, and expected values at the span level, which then flow into CI/CD-integrated evaluation experiments.
Helicone provides only light reviewer workflow support and focuses more on cost and latency monitoring.
| Platform | Native Annotation Queues | Feedback API / Widget | Evaluator Integration |
|---|---|---|---|
| Latitude | Yes (Issue-linked) | Yes | GEPA (auto-generated) |
| LangSmith | Yes (Single & Pairwise) | Yes | Manual & automated |
| Langfuse | Yes | Yes | Manual & LLM-as-a-judge |
| Braintrust | No | Yes | CI/CD integrated |
| Helicone | No | Limited | Limited |
This workflow falls apart if each platform uses different labels or review rules. That’s why schema design is the main choke point: without consistent labels, these platform features won’t turn into evals you can trust.
Building Annotation Schemas That Improve Evals and Prevent Regressions
Once feedback is normalized, the next choke point is the schema.
Choose a Schema Reviewers Can Apply Consistently
Keep the schema small: pass/fail, a short reviewer note, a failure label, and a corrected reference output. The big risk here is label drift. As new reviewers come in, definitions can get fuzzy. So keep the form to five fields or fewer, and assign one domain expert to settle disagreements and own the schema.
Start with binary labels. Then, after reviewing a small batch of 30–50 traces , add category labels based on the failure patterns you actually see.
Use Annotated Traces to Build Continuous Evaluation
When reviewers tag traces in the same way, those labels stop being just notes. They become test cases.
Use them to build a golden set for CI/CD regression tests. Each annotated failure becomes a clear check you can run against a new prompt or model version before it goes live. And if definitions change over time, versioned schemas help keep that golden set usable.
Top teams treat label schemas like code. They use version IDs, migration scripts, and schema compatibility checks.
Conclusion: Making Feedback Actionable With Annotations
This loop matters because annotated traces turn one production failure into a regression test you can reuse. Annotations tie a single trace to a named failure category, a corrected output, and a test case that helps stop the same bug from reaching users twice.
The best teams close the loop fast: production failure, annotation, eval, fix.
FAQs
What makes an annotation useful?
An annotation helps when it adds structured, context-rich human judgment to a specific production trace.
Put simply: it works best when it’s attached to the full execution context, not floating on its own. That means the annotation should sit alongside the prompts, tool calls, and retrieved data tied to that trace.
Tools like Latitude make this easier by linking feedback to specific message ranges or conversation turns. That connection matters. It turns qualitative insight into action-ready data you can use for debugging and evaluation.
How many traces should we label first?
You don’t need to label every trace. Start with the ones most likely to show where things are breaking.
For a specific failure mode, 10 to 20 well-annotated traces are usually enough to pull out useful signals. Platforms like Latitude can start spotting repeating error clusters with as few as 10 traces. Put your time into default system queues and the clusters with the highest product impact instead of pulling random samples.
When should human review override automated scoring?
Human review should take priority over automated scoring when a task calls for nuance, subjective judgment, or deep expertise, especially in fields like law, medicine, and engineering.
It also makes sense when you need to check specific failure modes, fine-tune automated evaluations, or make hard ethical calls. Automated metrics are great at handling volume and keeping scoring consistent. But they often miss things that people catch right away, like emotional depth, brand voice, cultural fit, and the gap between a small slip-up and a serious error.