
Most LLM incidents do notstart in the model. In many U.S. production systems, the first break happens in prompts, retrieval, tool use, routing, or runtime limits. If I only look at the bad answer, I can miss the actual fault and waste hours changing the wrong layer.
Here’s the short version:
-
Classify the failure by layer, not just by symptom
-
Rebuild the trace from retrieval, prompt, tool calls, and runtime logs
-
Find the first broken step
-
Replay the incident with fixed inputs to test one layer at a time
-
Turn the fix into an eval and CI/CD regression test
A few numbers make the point fast:
-
60%–80% lower MTTR is possible with a clear RCA process
-
41.9% of LLM failures take more than 24 hours to fix
-
About 45% of production failures span two or more categories
-
Long-context issues can cut accuracy by 30%+
-
One missed agent loop pushed weekly API spend from $127 to $47,000
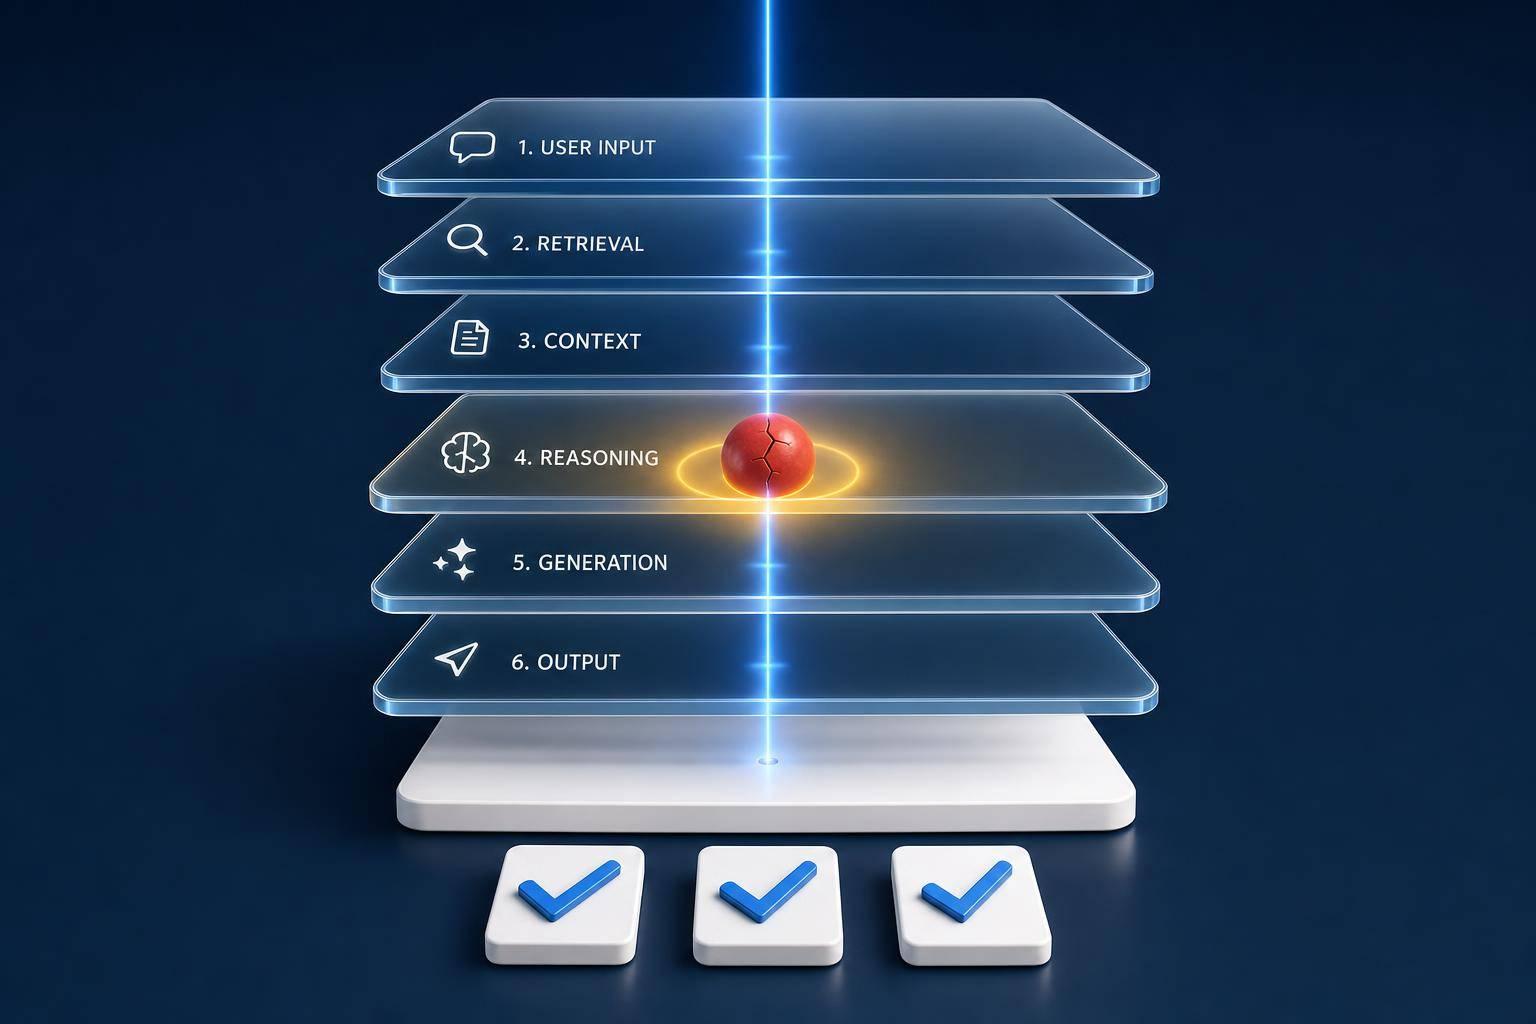
If I were setting up RCA for an LLM app, I’d focus on six buckets first:
-
Output/factual : made-up facts, fake citations, partly wrong answers
-
Reasoning : the data is there, but the conclusion is wrong
-
Prompt/config : vague rules, conflicting instructions, format misses
-
Retrieval : stale, irrelevant, or missing context
-
Agent/orchestration : bad tool choice, looped calls, wrong tool inputs
-
Infrastructure/cost : timeouts, provider errors, token overruns, spend spikes
I’d also make sure logging is in place before an incident happens. At a minimum, I need:
-
Retrieved chunks, scores, source metadata, and index timestamps
-
The rendered prompt , raw model output, model version, and token counts
-
Tool selection logic, tool arguments, raw tool results, and agent call graphs
-
Cost per request in U.S. dollars
The main idea is simple: detection tells me that something broke; RCA tells me where it first broke. Once I know that, I can fix the right layer, verify it with replay, and stop the same issue from coming back.
A Practical Taxonomy of LLM Failure Modes in Production
A taxonomy helps turn messy logs into incident buckets you can act on. The point is simple: separate lookalike symptoms into different buckets so each failure maps to the layer that caused it, not just the error the user happened to see.
Output, Reasoning, and Safety Failures
Start by splitting output failures into three groups: unfaithfulness , confabulation , and factual error.
-
Unfaithfulness means the model ignores the context it was given.
-
Confabulation means it invents things that don’t exist.
-
Factual error means the general frame is right, but some details are wrong.
That split matters because each one points to a different fix. Two answers can look equally wrong on the surface and still come from very different causes. The fix has to follow the layer that failed, not the symptom.
Reasoning failures are different. Here, the model has the right information but still lands on the wrong answer. A well-known case is the reversal curse : a model trained on “A is B” may fail to infer “B is A.” Safety failures can show up as sycophancy , where the model drops a correct answer just to agree with a user’s false premise.
If an answer is grounded in facts but still ends up wrong, the issue is no longer about generation. It’s about reasoning.
Prompt, Retrieval, Agent, and Infrastructure Failures
Prompt and config defects sit in the prompt layer. These issues often sail through dev tests and then break under production traffic. Ambiguous instructions, missing constraints, and conflicting system messages all fit here. In practice, long and conflicting instructions tend to fall apart in production.
Retrieval failures can look a lot like knowledge failures, but the line between them is pretty clear. If the right information never made it into the retrieved context, that’s a retrieval issue. If the information was there and the model ignored it or contradicted it, that’s unfaithfulness.
Long-context failures are their own thing. When the key passage is buried in the middle of a long prompt, models tend to do better with content near the beginning and end than with content in the middle. That’s the classic lost-in-the-middle pattern, and accuracy can drop by 30%+.
If the content is right but execution still fails, the next place to look is orchestration and runtime. Tool loops, wrong tool choice, and wrong-but-successful tool calls belong in the agent/orchestration bucket. Provider outages, rate limits, timeouts, and token budget overruns should be tracked on their own so they don’t get dumped into model or prompt buckets by mistake. In agent systems, loop guards and circuit breakers can stop repeated tool calls before they spiral.
| Failure Category | Symptoms | Detection Method |
|---|---|---|
| Output / Factual | Confident but wrong info, fabricated citations | RAG context inspection, fact-checking evals |
| Reasoning | Correct steps but wrong conclusion, logic gaps | Trace replay |
| Prompt / Config | Ignoring constraints, format violations | Zero-shot testing, prompt simplification |
| Retrieval | Stale info, irrelevant or missing context chunks | Retrieval precision/recall metrics, manual context injection |
| Agent / Orchestration | Infinite loops, wrong tool selection, wrong but successful tool calls | Tool-call graph analysis, loop detection alerts |
| Infrastructure / Cost | Timeouts, 500 errors, budget overruns | Latency distribution tracking, token-per-session caps |
About 45% of production failures involve two or more categories at the same time. So even when the fix touches more than one layer, naming the primary cause still matters. That primary label tells you which trace, graph, or log to inspect next.
Once the primary failure mode is labeled, trace reconstruction and reproducibility testing become the next step.
Root Cause Analysis Workflow for LLM Incidents
Once you bucket the failure, rebuild the trace and test the first point where things drifted. Don’t jump straight to “fix the prompt.” That’s often just the loud symptom, not the source of the problem.
The job here is simple: find the first broken layer.
Structured traces and replay are what make RCA much faster in production. The workflow has six steps: define the failure, map the layer, reconstruct the trace, isolate the cause, replay it deterministically, and validate the fix.
Trace Reconstruction and Causality Assessment
Trace reconstruction means walking backward from the failure until you hit the first divergent step. With structured spans - especially OpenTelemetry GenAI conventions like invoke_agent, execute_tool, and llm.call - you can inspect the flow step by step: the prompt that was sent, the documents that were retrieved, each tool input and output, and the final response.
Change one layer at a time. If you want to test retrieval, manually inject a “golden” document - the ideal context - and run the request again. If the model gets the answer right with that injected context, retrieval is the problem. If the retrieved context is right and the output is still wrong, the fault sits in the prompt or in model behavior.
Hypothesis Testing and Reproducibility for Non-Deterministic Failures
Non-determinism is the hardest part of LLM debugging. Even at temperature=0, accuracy can swing by as much as 15% because of infrastructure-level factors such as continuous batching and floating-point ordering. So if a request fails once, a simple re-run doesn’t give you much you can trust.
The safer path is deterministic replay. Capture production interactions as immutable JSON events, then replay them with deterministic stubs that replace recorded outputs for live LLM or tool calls. That lets you test a different prompt version or model against the exact same historical failure, without noise from live inference.
For the prompt layer, input ablation works well. Strip the prompt down to its smallest form, then add parts back one by one until the failure returns. The part that flips the result is your likely root cause.
Replay should help you answer one plain question: is the break in retrieval, prompting, or reasoning?
RCA Patterns for Reasoning Failures
Reasoning failures are the hardest class to debug because the model gives a smooth, confident answer - and it’s still wrong. The trick is to treat these failures like diagnostic signatures that point back to a layer.
-
Fabricated evidence (invented citations or made-up statistics) → retrieval or generation layer; grounding is not enforced.
-
Temporal mistakes (old information framed as current) → retrieval layer; the RAG corpus contains stale documents.
-
Anchoring bias (putting too much weight on content at the start or end of a long context) → context capacity layer; performance can drop by more than 15% when key information sits in the middle.
The same hallucination can come from opposite causes. A model may hallucinate because it doesn’t have enough information. Or it may hallucinate because it has too much and can’t stay focused.
One useful diagnostic rule: inject an error into an intermediate step and see whether the final answer changes. If the answer stays the same even after the reasoning path is corrupted, the model is post-hoc rationalizing instead of using the reasoning chain.
Using Observability and Evaluation Platforms to Debug Faster
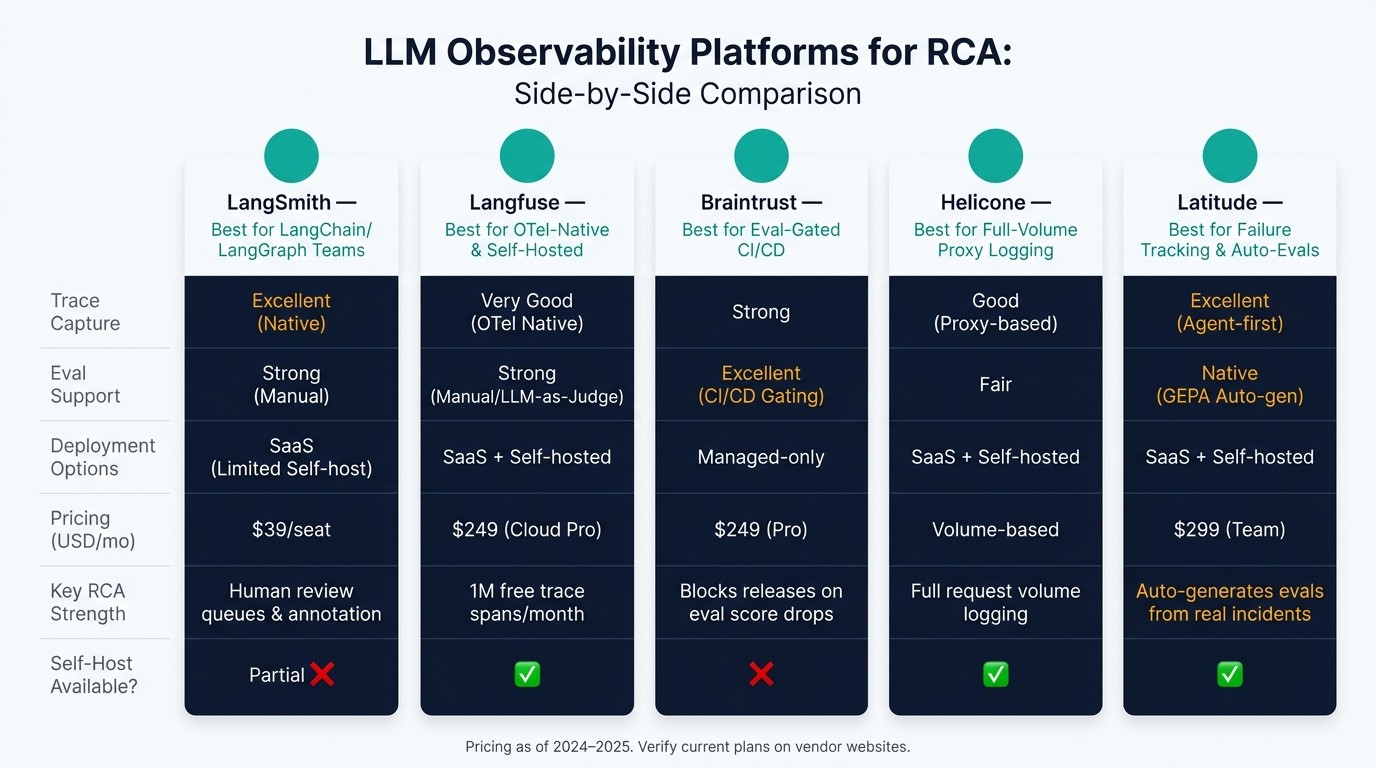
LLM Observability Platforms Compared: LangSmith vs Langfuse vs Braintrust vs Helicone vs Latitude
Once trace replay shows where a failure begins, observability platforms make that work repeatable. After you isolate the layer that broke, the next problem is plain old speed. You need tools that keep traces, evals, and review notes in one place so your team isn’t jumping between tabs.
What to Look for in an RCA Platform
Start with platforms that capture traces natively and also support evals, review, alerting, and retention. It also helps to have automated evals, human review queues, alerting, and retention controls built into the same setup.
How LangSmith, Langfuse, Braintrust, Helicone, and Latitude Fit Different RCA Workflows
Each platform has its own center of gravity for RCA work.
LangSmith makes sense for teams already using LangChain or LangGraph. It has native trace capture and human review queues, which helps when you need to flag and annotate bad outputs.
Langfuse is a good fit for teams that want OpenTelemetry-native, self-hostable tracing. Its free tier includes 1 million trace spans per month , and eval support depends on manual annotation or LLM-as-judge setups.
Braintrust works well for teams that gate releases on eval scores. It can act as a deployment gate in CI/CD pipelines and block a release if evaluation scores drop below a set threshold. It’s managed-only, so there’s no self-hosting option.
Helicone is useful as a proxy for full-volume request logging, though its eval and failure-tagging features are lighter than the others.
Latitude helps surface failure modes as trackable bugs and auto-generates evals from real incidents. That makes it a strong option for teams that want RCA tied straight to regression prevention.
| Platform | Best For | Trace Capture | Eval Support | Deployment | Pricing (USD) |
|---|---|---|---|---|---|
| LangSmith | LangChain / LangGraph teams | Excellent (Native) | Strong (Manual) | SaaS (Limited Self-host) | $39/seat/mo |
| Langfuse | OTel-native, self-hosted tracing | Very Good (OTel Native) | Strong (Manual/LLM) | SaaS / Self-hosted | $249/mo (Cloud Pro) |
| Braintrust | Eval-gated CI/CD releases | Strong | Excellent (CI/CD) | Managed-only | $249/mo (Pro) |
| Helicone | Full-volume proxy logging | Good (Proxy-based) | Fair | SaaS / Self-hosted | Volume-based |
| Latitude | Failure tracking and auto-generated evals | Excellent (Agent-first) | Native (GEPA Auto-gen) | SaaS / Self-hosted | $299/mo (Team) |
Those traces then feed incident review, evals, and regression tracking.
Running RCA as an Ongoing Process in U.S. Production Environments
Once traces and evals show where the failure happened, the review process should turn that finding into a repeatable prevention loop. In practice, RCA should keep going as an operating habit, not stop at a one-time postmortem. Run blameless reviews that name the change, the failed layer, and the regression trigger. Then assign a clear owner and use the same failure taxonomy across engineering, product, and risk teams. Escalation paths and review cadence should be spelled out, not left vague.
Metrics, Incident Reviews, and Regression Prevention
Use the same failure taxonomy from earlier sections to tag incidents, trends, and regressions.
Track five metrics:
-
Quality : hallucination rate, task success rate
-
Safety : refusal rate, safety scores
-
Performance : p95 latency in milliseconds
-
Throughput : request volume
-
Cost : cost per request and monthly spend ($)
Sudden shifts in volume or traffic mix can expose routing problems fast. If one tool’s traffic share jumps from 20% to 80% overnight, that’s a routing failure signal, not normal growth.
Each major incident should end with two concrete outputs: a validated fix confirmed by evals, and a regression test added to CI/CD. Production failures should become regression cases because they reflect edge cases that synthetic tests often miss. One undetected agent loop ran for 11 days and pushed weekly API costs from $127 to $47,000. A circuit breaker that stops after three failures in 30 seconds would have contained it.
Each closed incident should leave something behind: a test, a guardrail, or a metric threshold.
Use the table below to map each failure type to severity, risk, and the evidence needed to close the incident.
| Failure Category | User Severity | Business Impact | Compliance Risk | RCA Depth | Required Evidence |
|---|---|---|---|---|---|
| Safety/Policy Breach | P0 – Critical | High (Legal/Brand) | High (PII/Safety) | Deep (Full Audit) | Red-team logs, safety filter traces, input/output pairs |
| Core Workflow Outage | P0 – Critical | High (SLA/Revenue) | Low | Standard SRE | Latency metrics, provider logs, error rates |
| Hallucination/Fact Error | P1 – High | Moderate (Trust) | Moderate (Liability) | Moderate (Ablation) | Retrieval spans, source documents, grounding scores |
| Logic/Reasoning Error | P1 – High | Moderate (Utility) | Low | Moderate (CoT traces) | Intermediate reasoning traces, tool call arguments |
| Format/Schema Violation | P2 – Low | Low (UX friction) | Low | Shallow (Schema) | Output parser logs, validation error messages |
Conclusion: Building a Repeatable System for Finding Causes and Preventing Repeats
Standardize the taxonomy, capture full traces, and version each layer: prompt, policy, model runtime, and tools. Move validated fixes into evals, then into CI/CD. That loop - detect, diagnose, fix, verify, automate - helps stop the same incident from coming back. Since 88% of AI agent failures in production trace back to infrastructure gaps rather than model quality, teams should put instrumentation, guardrails, and regression tests right alongside prompt changes.
FAQs
How do I find the first broken layer?
Work through the pipeline in order, from retrieval to generation. Errors tend to snowball, so isolate each part first. That way, you can find the root cause instead of chasing a later symptom.
Start with the retrieval trace. If the retrieved chunks don’t include the right answer, the problem sits in retrieval. Check cosine similarity, then look for stale embeddings or weak chunking.
If retrieval looks correct, replay the trace using the same context. If the answer still fails at that point, generation is the issue.
What should I log before an incident happens?
Log full requests and responses. That means the complete prompt, model version, sampling settings, and timestamps.
If your system has multiple steps, log each execution span too. Include tool inputs, raw outputs, latency, errors, and any intermediate decision points. If something goes wrong, you want the whole trail, not just the final result.
For RAG, store the query, retrieved chunks, and the embedding model version. Also keep immutable prompt and config versions so you can trace failures and roll back if performance drops.
How do I turn one failure into a regression test?
Capture the full production trace: the input, the model’s reply, any tool calls, and the retrieved context. Then look at what went wrong, give that failure a clear label, and save the trace as a versioned dataset row so you can replay the same case later.
Next, build a scorer that checks for the behavior behind the miss , not just that one bad answer. Add that scorer to CI so releases get blocked if the same pattern shows up again. Latitude can help by generating evaluations from production traces.