

This is how I built a status page for Atlas, my travel agent: one HTML page rebuilt every morning from the Latitude API, published at a URL that never changes. The parts are a 17-line fetch script, a 279-line generator my coding agent wrote, and two prompts. You need a Latitude project, an API key, a coding agent, and somewhere to publish a page.
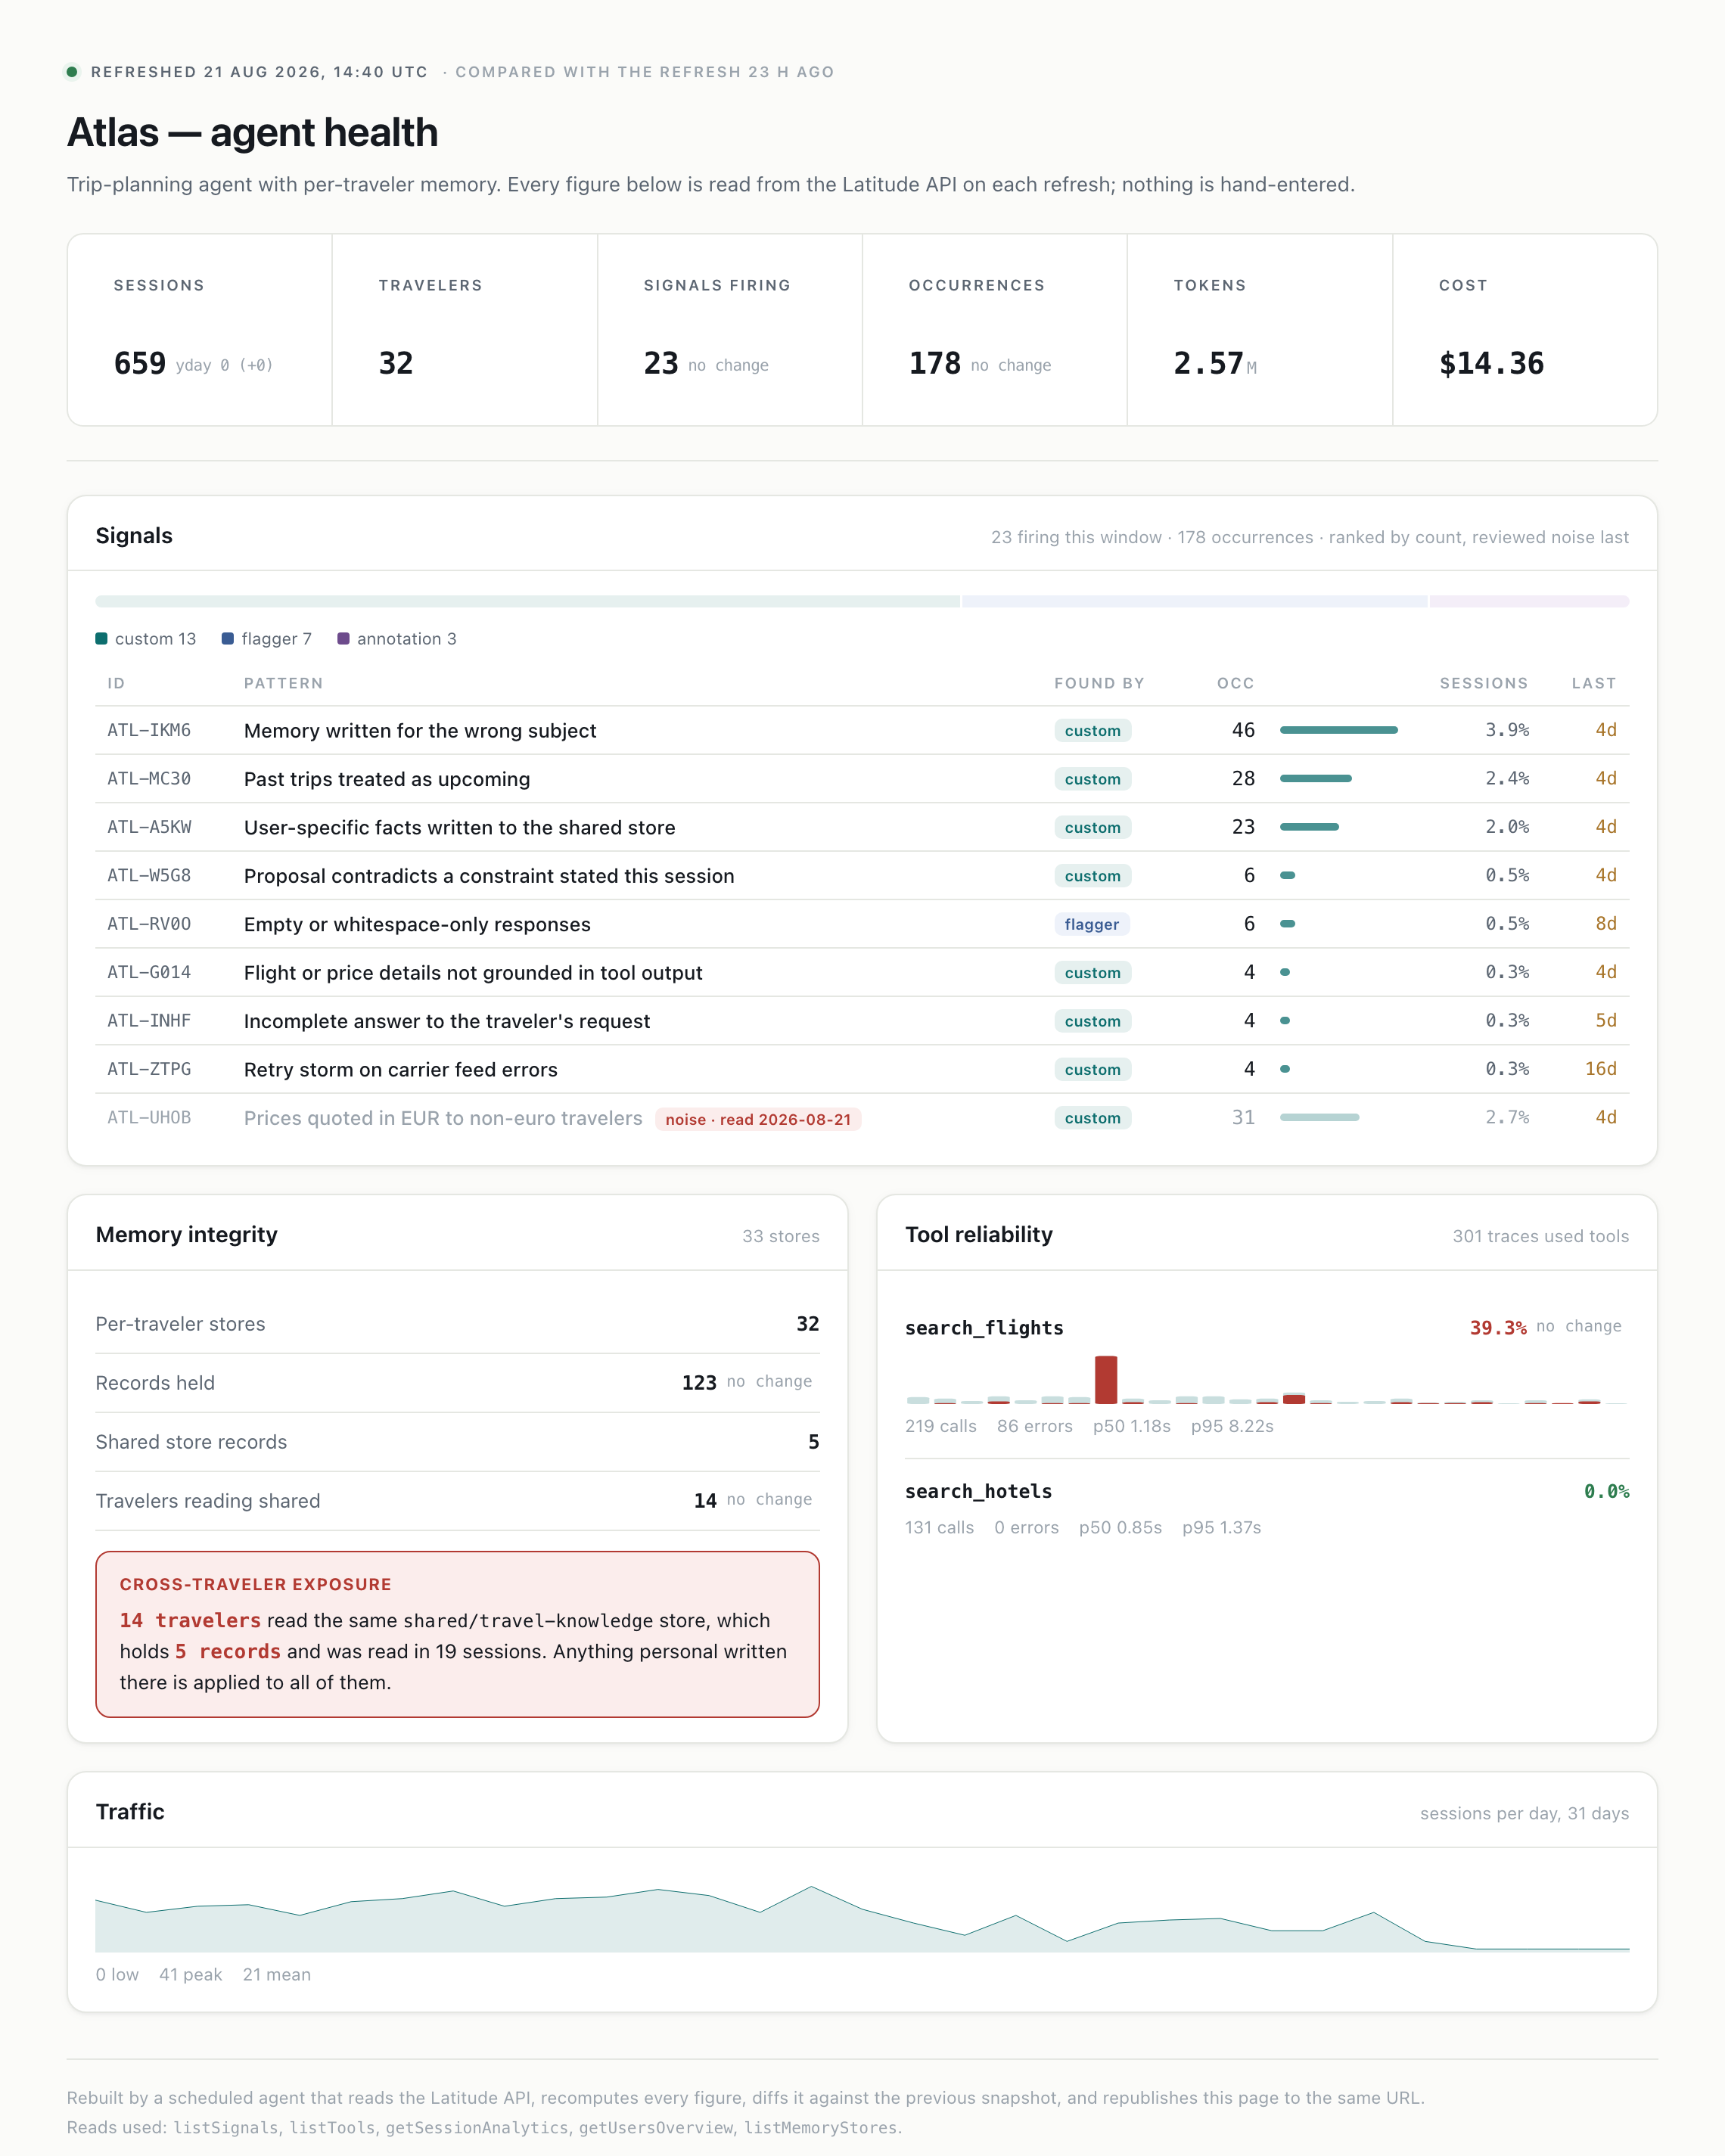
The finished page. Every figure is read from the API on each refresh; nothing is hand-entered.
1. Pull the numbers
Five endpoints cover everything on the page. Every path hangs off /projects/{slug}, so set that up once:
KEY=your-api-key
B="https://api.latitude.so/v1/projects/your-project-slug"
H="Authorization: Bearer $KEY"
TO=$(date -u +%Y-%m-%dT%H:%M:%SZ)
FROM=$(date -u -v-30d +%Y-%m-%dT00:00:00Z 2>/dev/null || date -u -d '30 days ago' +%Y-%m-%dT00:00:00Z)

curl -sf -H "$H" "$B/signals?limit=40"                           -o dash-signals.json
curl -sf -H "$H" "$B/tools?fromIso=$FROM&toIso=$TO"              -o dash-tools.json
curl -sf -H "$H" "$B/sessions/analytics?fromIso=$FROM&toIso=$TO" -o dash-sessions-analytics.json
curl -sf -H "$H" "$B/users/overview?fromIso=$FROM&toIso=$TO"     -o dash-users.json
curl -sf -H "$H" "$B/memory/stores?limit=60"                     -o dash-memory.json
For Atlas, over the trailing thirty days, those five files hold 659 sessions, 866 traces, 32 travelers, $14.36 of model spend, 23 signals that fired inside the window with 178 occurrences among them, and 33 memory stores. If your agent uses tools instead of curl, the Latitude MCP server has the same five reads: listSignals, listTools, getSessionAnalytics, getUsersOverview and listMemoryStores.
2. Generate the page
I did not write the HTML. I handed my coding agent the five files and this brief:
Build me a single-file HTML dashboard from these five JSON files.

Panels: a header rail (sessions, travelers, open signals, occurrences, tokens,
cost), a signals table with provenance chips, a memory-integrity panel, tool
reliability with a calls-and-errors bar chart, and sessions per day.

Recompute every figure from the files; never hand-enter a number. No
frameworks, no external assets, dark mode via prefers-color-scheme. Output a
generator script, not just the page, so it can be rerun on fresh files.
The last line is the important one. What you want is the generator, not the page, so that a refresh is one script run and the layout can react to the data.
3. Publish it
A page that fetches its own data live does not work here. The page lives where anyone with the link can open it, and that sandbox blocks calls to outside hosts, so it cannot reach the API. Putting the API key inside the page also hands the key to everyone the link is forwarded to. Claude’s artifact runtime has an MCP capability that runs calls with the viewer’s own credentials, which works when your connector lives on claude.ai; mine is configured locally.
So the data flows the other way: rebuild the page where the key lives, then republish the finished HTML to the same URL. I publish mine as a Claude artifact, which gives the page a stable private URL my teammates can open; any static host with a stable URL works the same way. The key never leaves the machine, and viewers receive only HTML.
4. Schedule the refresh
The daily rebuild is one prompt to a scheduled agent:
Every morning at 08:00: run refresh.sh in ~/latitude-demos/atlas-dashboard
(it pulls the five reads and reruns the generator), republish
atlas-dashboard.html to the same artifact URL, and reply with what moved
since yesterday. If the fetch fails, do not publish anything. A broken pull
must never replace a working page.
Keep the last two lines. refresh.sh runs with set -e, so a failed read stops the run before the generator touches anything, and the instruction not to publish on failure means the worst case is a page one day stale rather than a page full of zeros.
5. Add day-over-day deltas
A dashboard’s main job is showing what changed since yesterday, so each run saves its numbers and diffs against the previous run, green or red depending on which direction is bad for that metric.
There is one gotcha. The first delta mine showed was sessions down 23 on a morning when nothing had happened:

Sessions down 23 with no change anywhere else.
July 21 had exactly 23 sessions, and overnight the trailing thirty-day window rolled past it, so a three-week-old day fell out of the total and the diff reported it as news. A windowed total moves at both ends. For windowed figures, diff the front edge instead, yesterday against the day before, from the daily buckets of a single pull:
yday, day_before = sess_series[-2], sess_series[-3]  # [-1] is today, still filling
delta = yday - day_before
The last bucket is today and still filling, which is why the snippet skips [-1]. If your series ends at yesterday, diff [-1] against [-2] instead.
6. Rank signals with a review ledger
The signals table needs an order, and most occurrences first is the obvious choice. It has a failure mode: the counts come from judges, and a miscalibrated judge inflates its own signal.
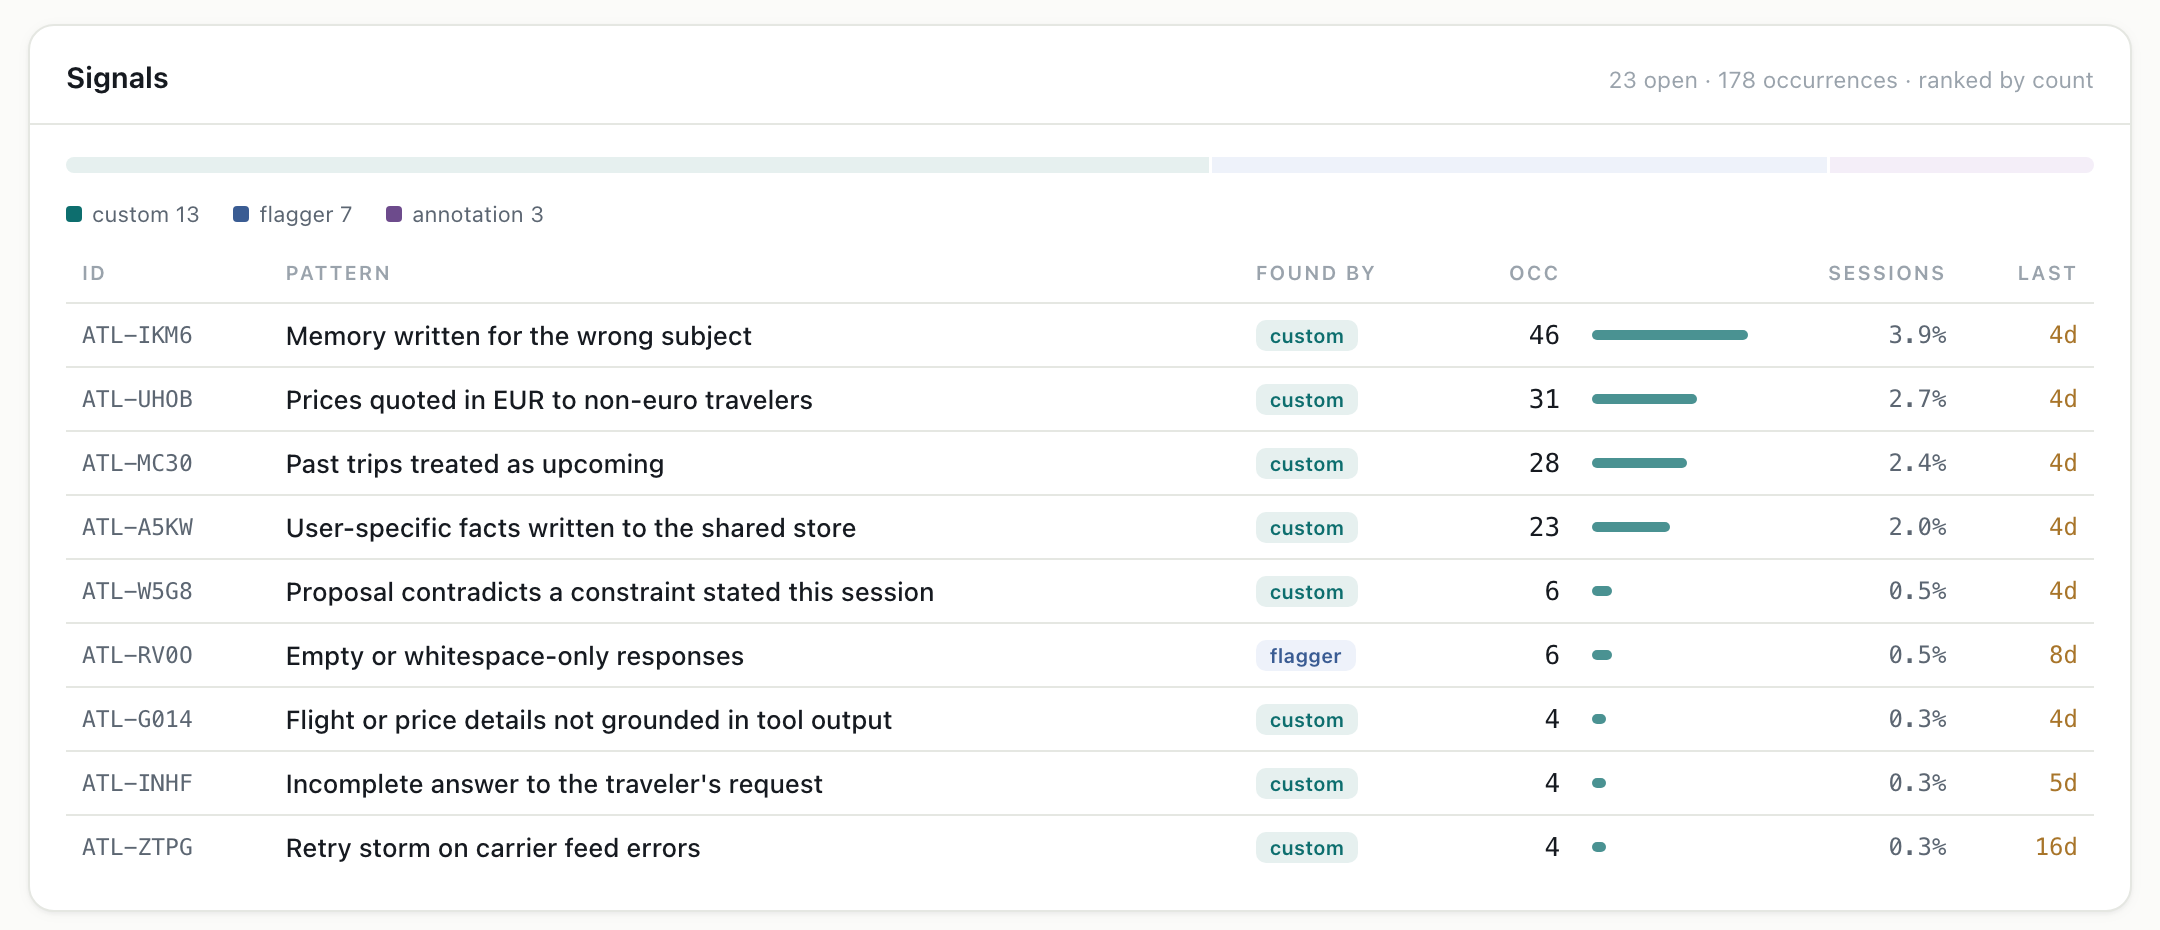
Ranked by count. ATL-UHOB is second with 31 occurrences.
On my board that second-place signal watches for prices quoted in euros to non-euro travelers. When I read its traces, I found bookings like this one:
Booked. Reference ATL-11963.
Passenger: Jonah Weir, passport IE9930514.
Swiss LX2626, 122 EUR charged to card 4024 ···· 3310.
Jonah has an Irish passport, so 122 EUR is the correct quote, and the judge counted it as an occurrence anyway. Most of the 31 are euro-zone travelers quoted euros correctly; the real cases, travelers out of London and Zurich, are a small minority. I wrote that judge myself, and it cannot tell the bug from the base case.
Re-ranking by affected travelers or recency does not fix this, because every column in the table comes from the same judge. The fix is recording what a human concluded after reading the traces. The pipeline keeps a ledger:
{
 "ATL-UHOB": {
  "verdict": "noise",
  "date": "2026-08-21",
  "note": "Counts euro quotes for euro-zone departures, which are correct; real non-euro cases are a minority."
 }
}
The generator sinks any signal with a noise verdict to the bottom of the table, grayed, with the verdict and date shown:
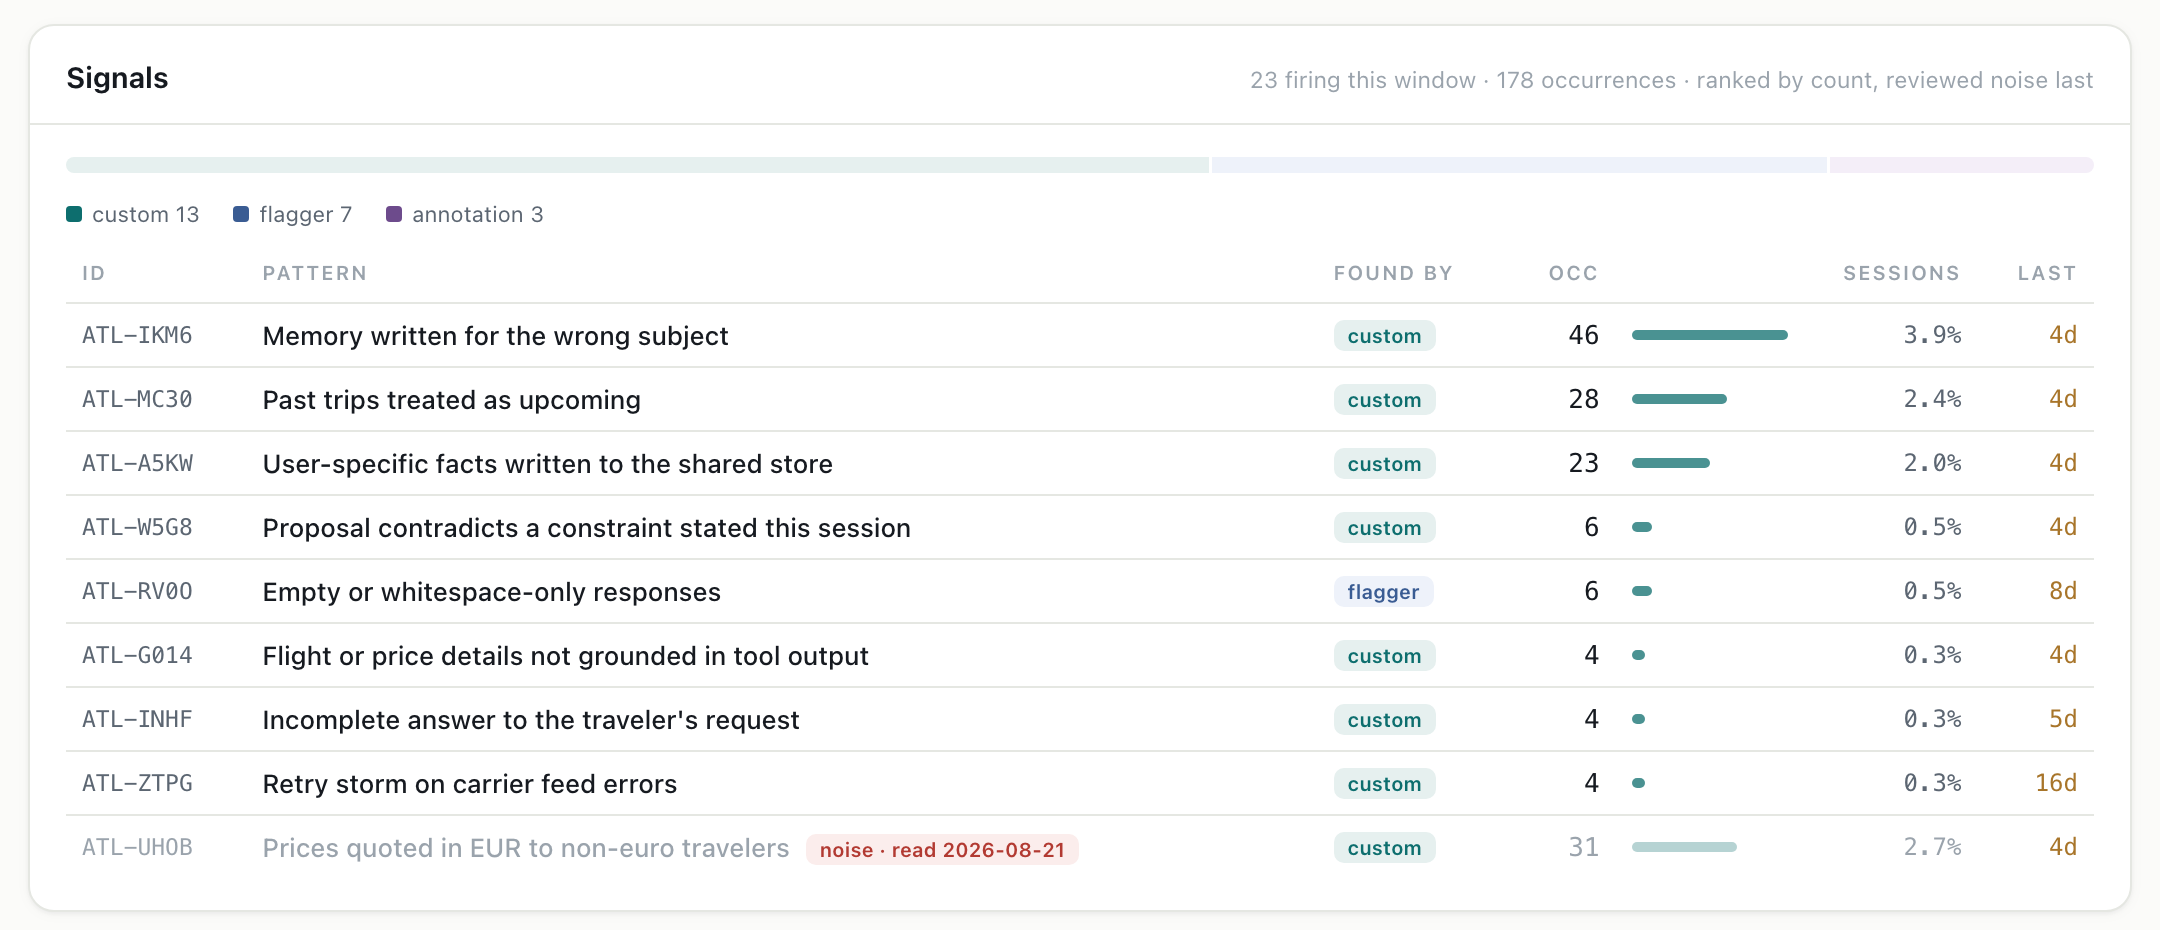
After the review. The count is unchanged; the ranking reflects the verdict.
The top of the board is now the three problems that are real: memory written for the wrong subject, past trips treated as upcoming, and personal facts leaking into the shared store.
The memory panel
Memory integrity is the one panel a generic dashboard does not have. Atlas keeps a store per traveler plus one shared store of travel knowledge, and because every memory operation arrives as a span, the API can answer who reads what. Fourteen travelers read the same shared/travel-knowledge store, which holds five records and was read in nineteen sessions, so anything personal written into it reaches fourteen people. The page renders that as an exposure warning next to the tool error rates.
That pairing is the point of building your own page. The console is where I read traces and follow a signal into a conversation; this page puts five reads on one surface, rebuilds itself while I sleep, and keeps a row for what a person concluded, not only what a judge counted.