

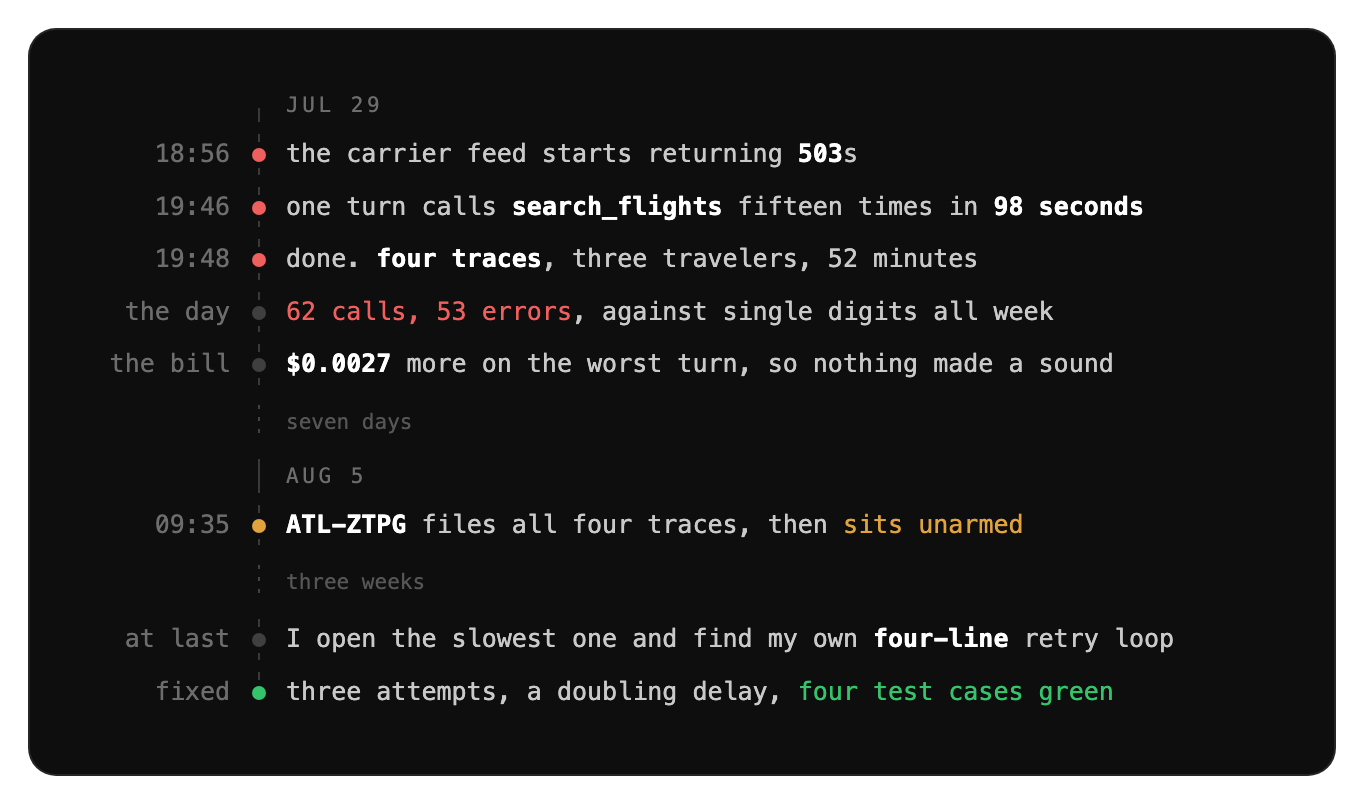
A traveler named Bruno asked my travel agent for flights one July evening and watched a spinner for seventy-four seconds. Half an hour later he came back and tried again, and the second wait was ninety-eight. He was the third traveler to hit the wall that evening, Viktor and Elena had each spent their own minute staring at the same spinner in the half hour before him, and the four conversations together amounted to about a third of a percent of that week’s sessions, which is the sort of number that gets triaged into next quarter. Nobody opens a ticket about one slow conversation, and for these four nobody needed to, because no human ever read them. Latitude’s flaggers screen every session for cheap evidence of failure, error spans, latency far off the baseline, the same tool called again and again inside a single turn, and each of these conversations tripped that screen. Four failures that looked alike got clustered into ATL-ZTPG, a retry storm on carrier feed errors, and that is how the whole thing reached me, grouped, named, and waiting.
I opened Bruno’s second conversation expecting to blame an airline, and at first the trace backed me up, because inside it search_flights had been called fifteen times and refused fifteen times:
19:46:34.532   503 after 4.8s
19:46:39.419   503 after 5.6s
19:46:45.062   503 after 3.7s
19:46:48.847   503 after 6.4s
19:46:55.320   503 after 8.4s
19:47:03.773   503 after 6.5s
19:47:10.325   503 after 3.5s
19:47:13.909   503 after 5.6s
19:47:19.546   503 after 8.6s
19:47:28.240   503 after 5.7s
19:47:34.018   503 after 4.6s
19:47:38.673   503 after 3.6s
19:47:42.353   503 after 9.0s
19:47:51.365   503 after 2.5s
19:47:53.882   503 after 7.9s
Fifteen 503s looks like an outage, and for about a minute I had the case closed, the vendor guilty, and nothing left to do but wait for the airline to fix its feed. Then the timestamps spoiled it. Every attempt begins in the same instant the one before it gives up, four seconds, then six, then eight, then nine, with nothing lengthening in between and nothing anywhere keeping count. Feeds go down, that is what feeds do, and the 503s belonged to the airline, but the fifteen belonged to whoever kept asking. Eighty seconds of asking a dead feed the same question is pestering, and I was the one doing it.
I wrote the thing doing the pestering and it is four lines long.
export async function runToolWithRetries(run: () => Promise<ToolOutcome>): Promise<ToolOutcome> {
  let outcome = await run()
  while (outcome.isError) {
    outcome = await run()
  }
  return outcome
}
It retries until the tool succeeds, and I want to be fair to it, because most days that is exactly the correct behavior and nobody ever hears about it. A feed blinks for half a second, the loop swallows the blink, and the traveler never finds out. That is the loop at its best. On the evening in question it was also the reason Bruno sat through ninety-eight seconds twice, because a knock that repeats until somebody answers is a very different thing depending on whether anybody is home. Four lines, and every one of them a knock.
Once I knew what shape to look for, finding the day was trivial.
Jul 26     5 calls    0 errors    p50 0.94s
Jul 27    10 calls    1 error     p50 0.96s
Jul 28     9 calls    1 error     p50 0.58s
Jul 29    62 calls   53 errors    p50 5.12s
Jul 30     7 calls    2 errors    p50 0.89s
Jul 31     5 calls    0 errors    p50 0.92s
Single digits on either side and sixty-two in the middle, of which fifty-three failed, and the four sessions I had started from accounted for the entire bulge, running seventy-four, seventy-eight, eighty-nine and ninety-eight seconds apiece. The airline was having a bad hour and my loop turned it into sixty-two calls, taking each refusal and manufacturing a dozen more against a service that kept telling it to go away. Sixty-two knocks at a door with nobody behind it.
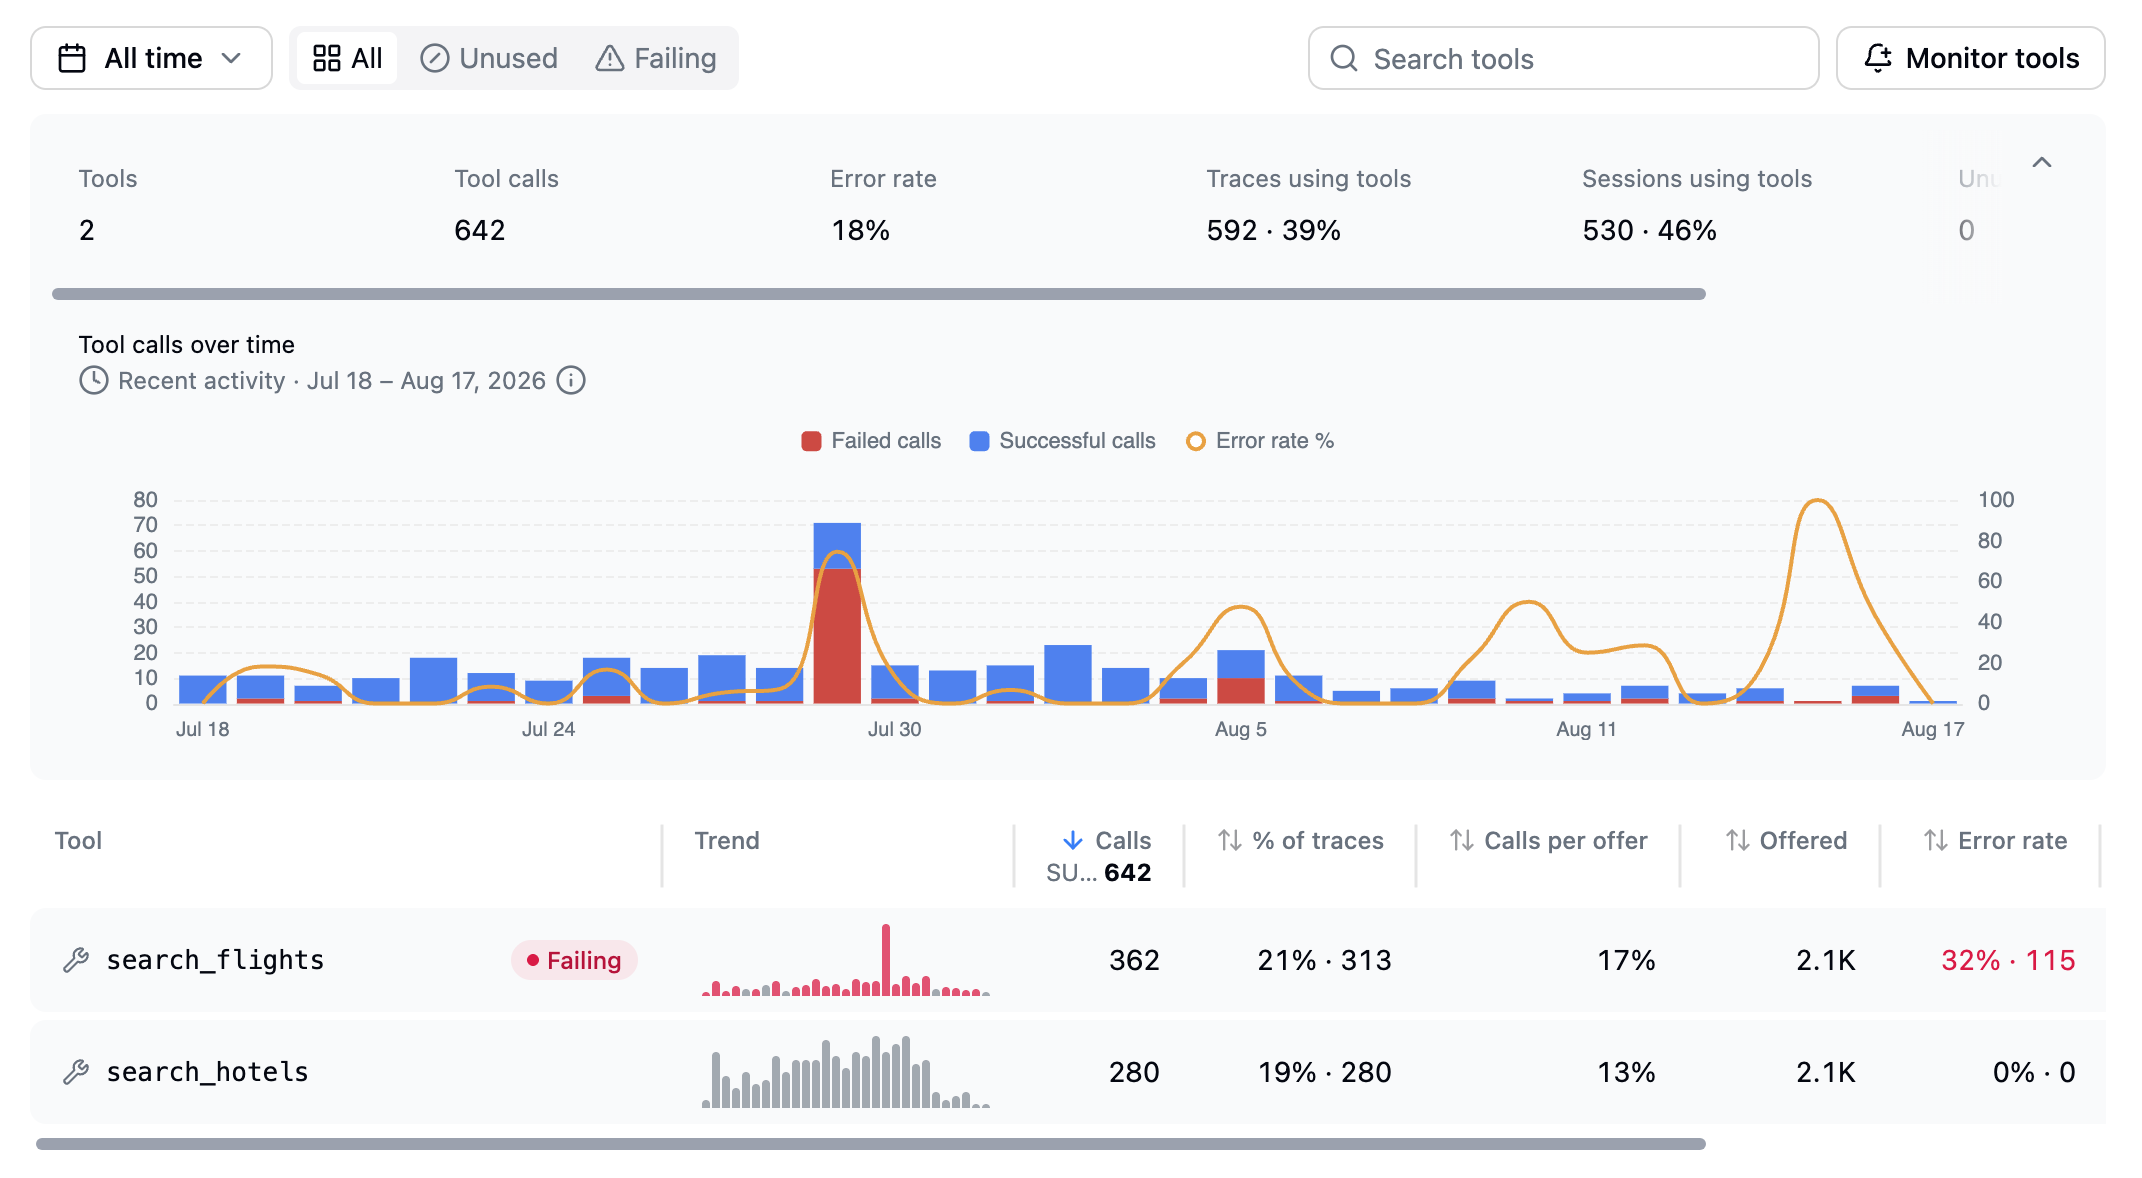
Thirty days of tool calls. The red spike is July 29.
Which raises the question of why nothing told me at the time, and the answer embarrasses me more than the loop does, because Latitude’s half of the work was already done. By the morning of August 5 the flaggers’ annotations on the four traces had been clustered under one name, and the signal sat on the project’s board with its evidence attached, waiting for one decision from me about what should fire if it grew. I stood up a monitor that same afternoon, felt responsible, and moved on, and the monitor I chose watches for traces already tagged as retry storms, which is confirmation rather than detection. I had pointed it at the answer instead of the question, and then I stopped looking for three weeks.
The storm had already come back while I was setting all that up. The daily numbers show a second burst across August 4 and 5, twenty-two calls and twelve errors, and it is visible in the chart above, the smaller red bar a week after the big one. My monitor was aimed at tagged traces, so it was never going to be the one that told me, and I was not looking at the page that was showing it. I only found the second storm this week, walking back through the daily counts after the fix the way you check the locks after a burglary.
So what should have been watching? Cost is the tempting answer and the worst one. Set an affected turn beside a healthy one and the duration goes from 8.1 seconds to 83.6, more than a tenfold stretch, while the spans go from three to sixteen, and the bill goes from $0.0157 to $0.0184. Twenty-seven ten-thousandths of a dollar. The retries are ordinary web calls that burn no model tokens at all, so the money barely budges, and any monitor I had hung on spend would have slept through both storms. Error rate is not much better, because the moment the loop engages it begins manufacturing failures of its own, and by the end of the hour the number was mostly describing my own code. A thermometer with its bulb in its own mouth.
What worked was two reads and no cleverness. Daily call volume found the day. Repeated calls inside one trace explained it.
The fix has to stop a sustained failure without exposing every brief one, which is a narrower target than it first appears, so I wrote the four cases down before touching anything.
Three of those four passed against the code I already had, and that is the part I have not stopped chewing on. The loop recovers from every blip because it never stops trying, so on every case where recovery is possible it looks like excellent engineering. It looked that way to me when I wrote it. It failed only the permanent case, and even there the loop ended because my fake feed relented, no line I had written ever said stop. The suite is only worth keeping because of the cases that pass. A healthy call has to run once, a brief failure has to still be able to recover, a second brief failure has to still be able to recover, and a sustained failure has to give up after a fixed number of attempts. A cap ends the unbounded loop and backoff spaces the knocks out, and the three passing cases are what stop me from “fixing” this by never retrying at all, which would pass one test and ruin the product.
The fix itself is dull, the way fixes usually are after an afternoon like that. Three attempts, a delay that doubles, and a wait of a quarter of a second before the second knock and half a second before the third.
export const DEFAULT_RETRY_POLICY: RetryPolicy = { maxAttempts: 3, baseDelayMs: 250 }

const sleep = (ms: number) => new Promise((resolve) => setTimeout(resolve, ms))

export async function runToolWithRetries(
  run: () => Promise<ToolOutcome>,
  policy: RetryPolicy = DEFAULT_RETRY_POLICY,
): Promise<ToolOutcome> {
  let outcome = await run()

  for (let attempt = 1; attempt < policy.maxAttempts && outcome.isError; attempt += 1) {
    await sleep(policy.baseDelayMs * 2 ** (attempt - 1))
    outcome = await run()
  }

  return outcome
}
It is one statement longer than what it replaced, it gives up after three attempts instead of never, and when it does the last error is handed back up and the traveler is told that the airline is not answering. Against the same four cases the permanently failing feed costs three calls rather than a thousand, the blip that clears on the second attempt costs two, the one that clears on the third costs three, and a healthy feed is called exactly once, which is the case I would have broken if I had just stopped retrying altogether.
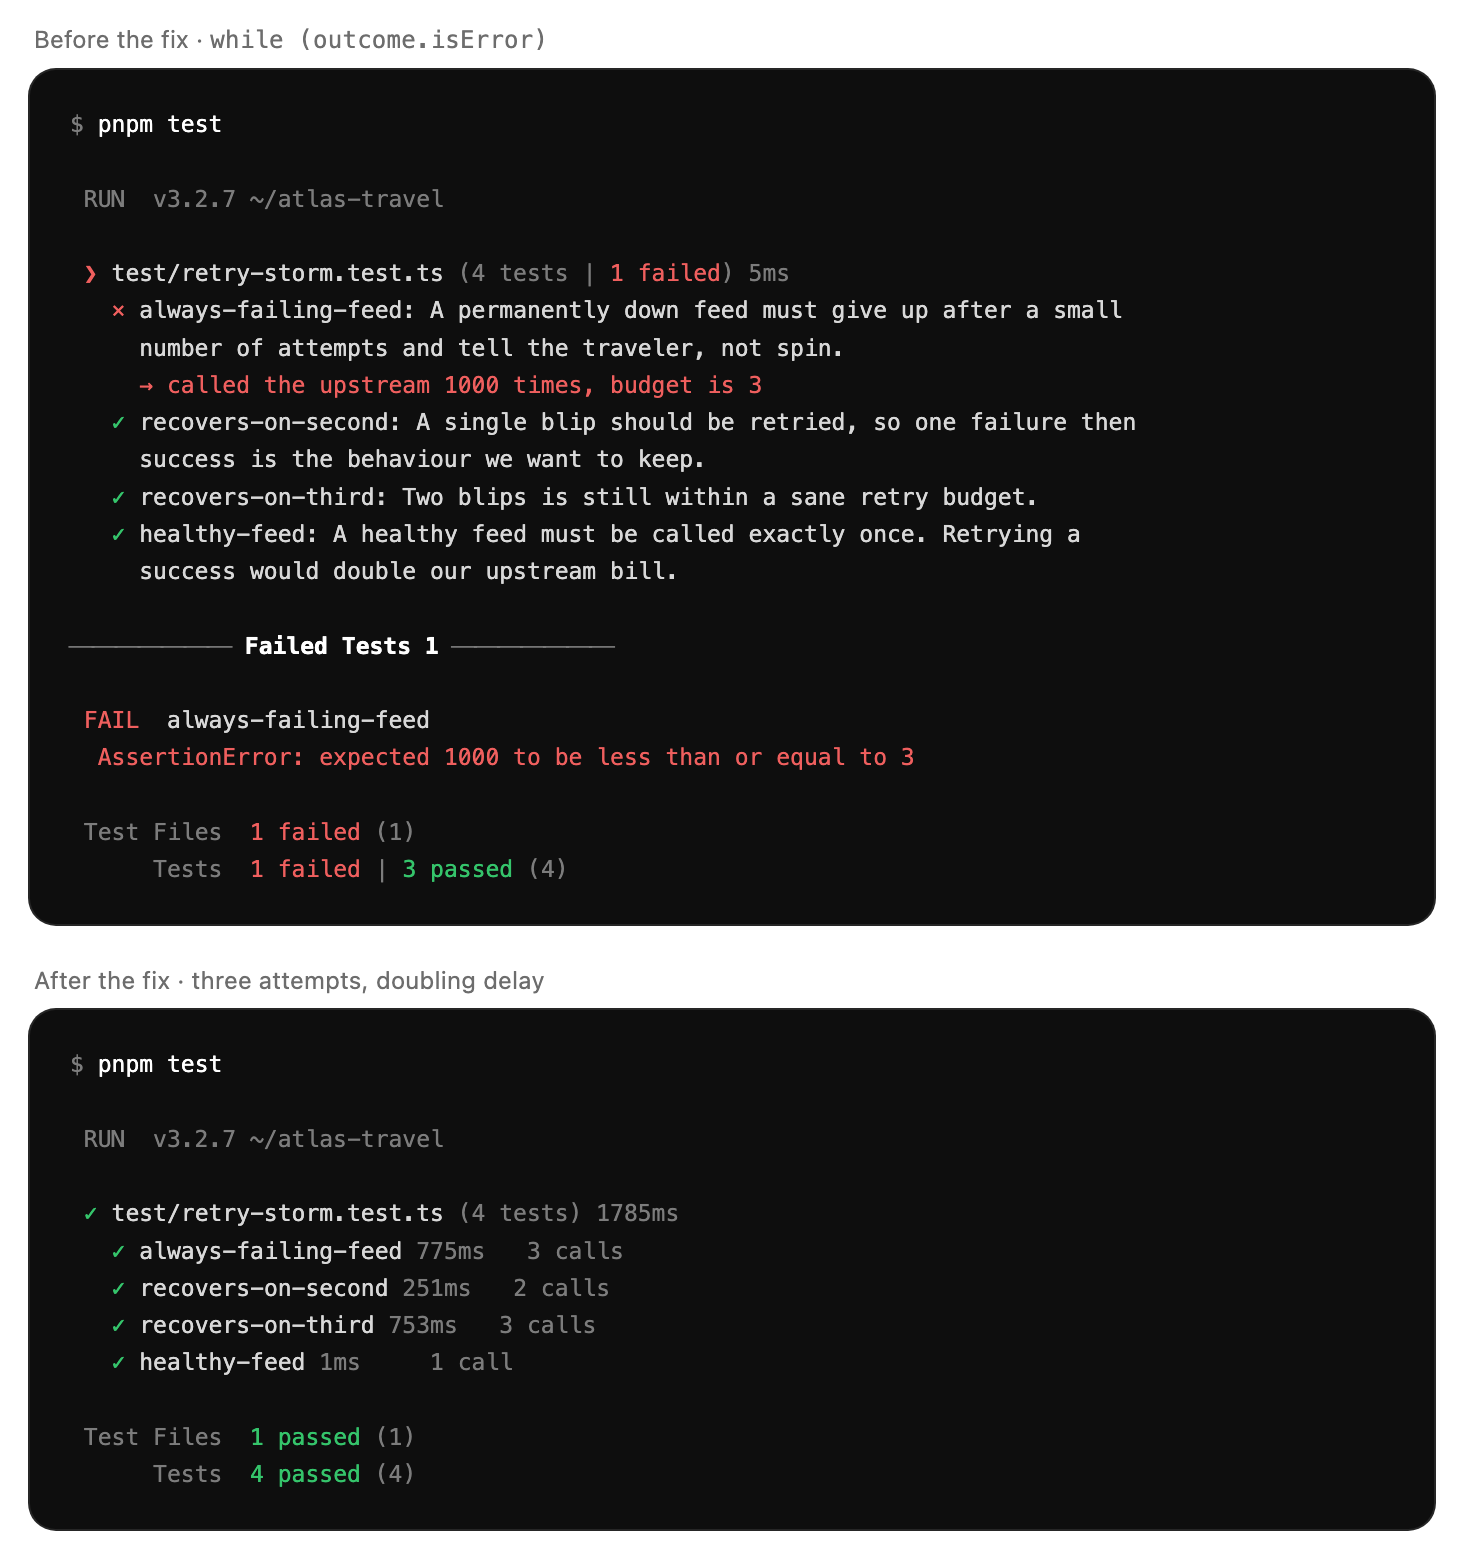
The same four cases against the old loop and the new one.
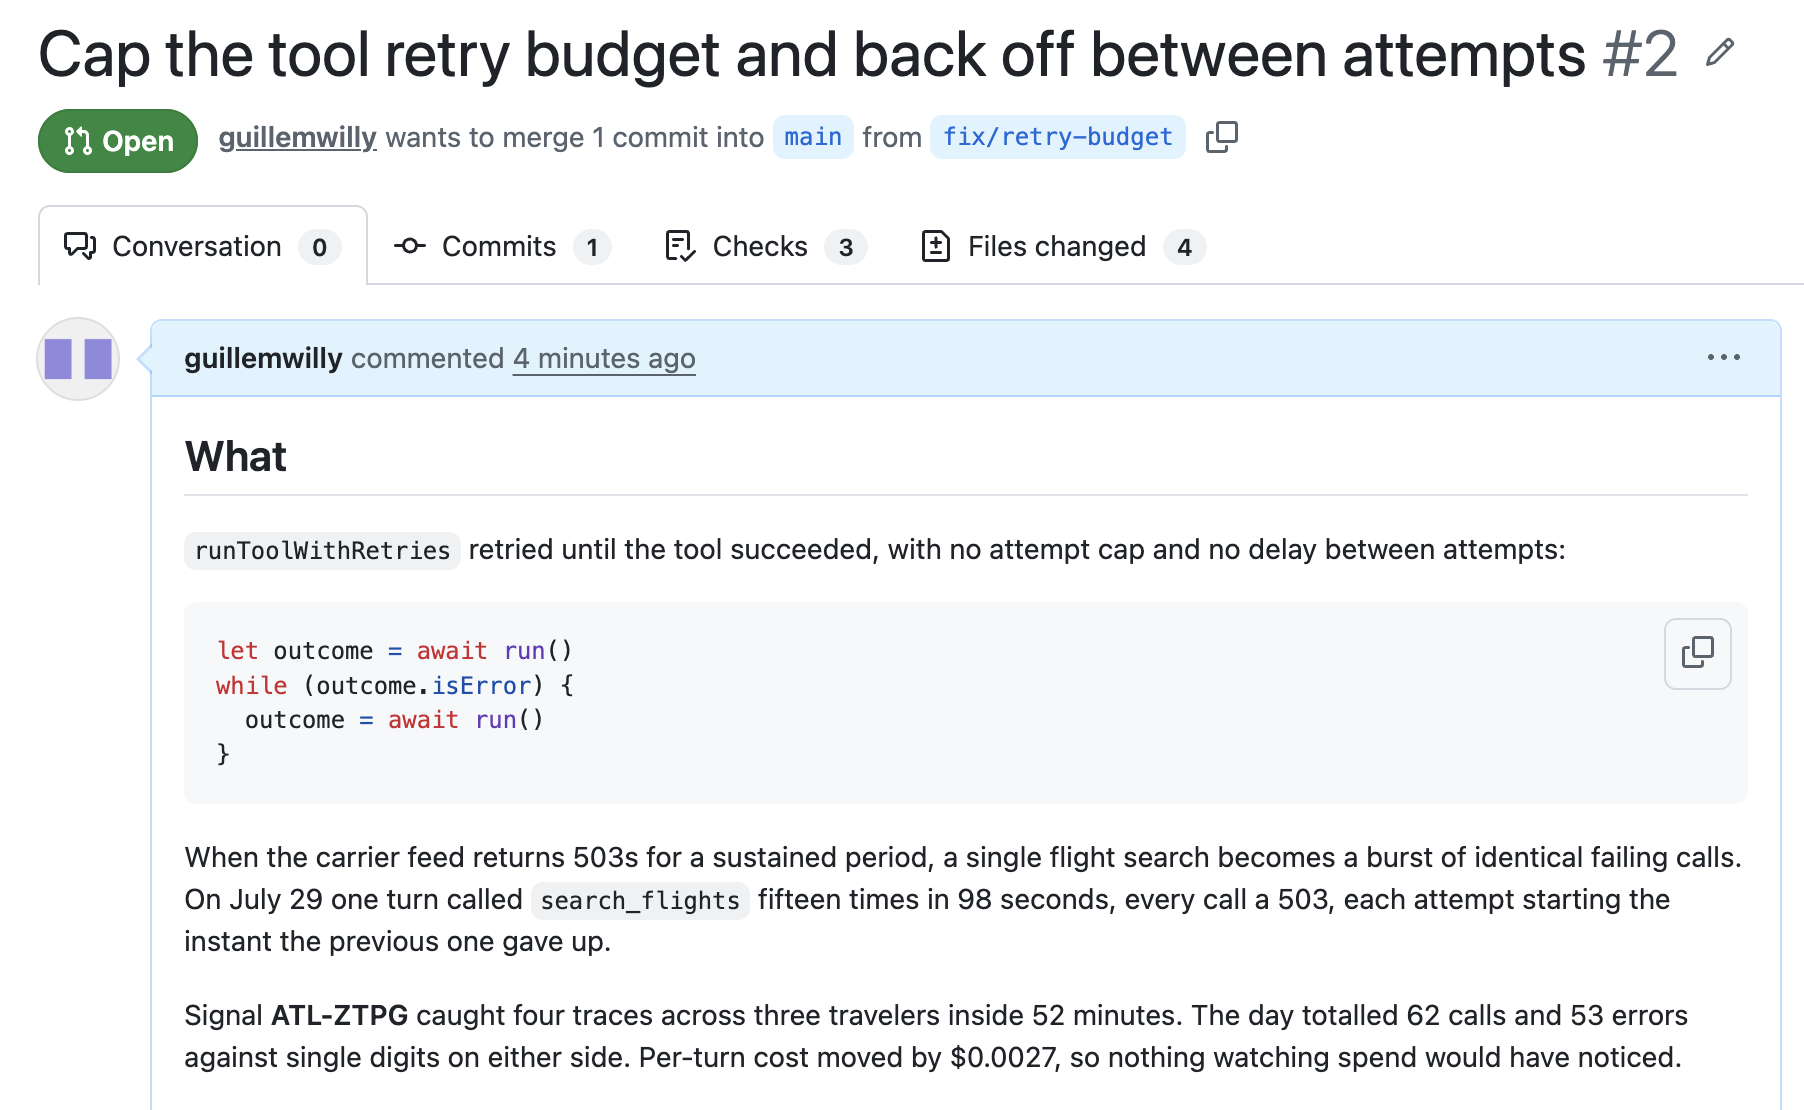
The pull request carries the signal and the trace it came from.
Catching the third storm does not require me to read every trace, thankfully, because I have neither the time nor the constitution. For each tool, compare the day’s call volume and error rate against the trailing baseline, open a single trace from any day that looks anomalous, and count how many times that trace called the same tool. The Latitude MCP server exposes all three of those reads, through listTools, listSignalTraces and listTraceSpans, so the sweep is something a coding agent can run on a schedule while I am doing something else, flagging the day, opening one affected trace, and reporting back how many times it knocked. The dull half of the lesson is that the sweep is not the part I got wrong. The reads were all there three weeks ago, and what was missing was a monitor pointed at the number that moves when this happens, which is the tool’s own error rate. There is one now, error rate against three times the trailing week, one createMonitor call made before I wrote this paragraph, and it watches every tool rather than only the guilty one, because nothing says the next storm starts at the same door. It reads the spans directly, and it gets to interrupt me on the evening it happens.
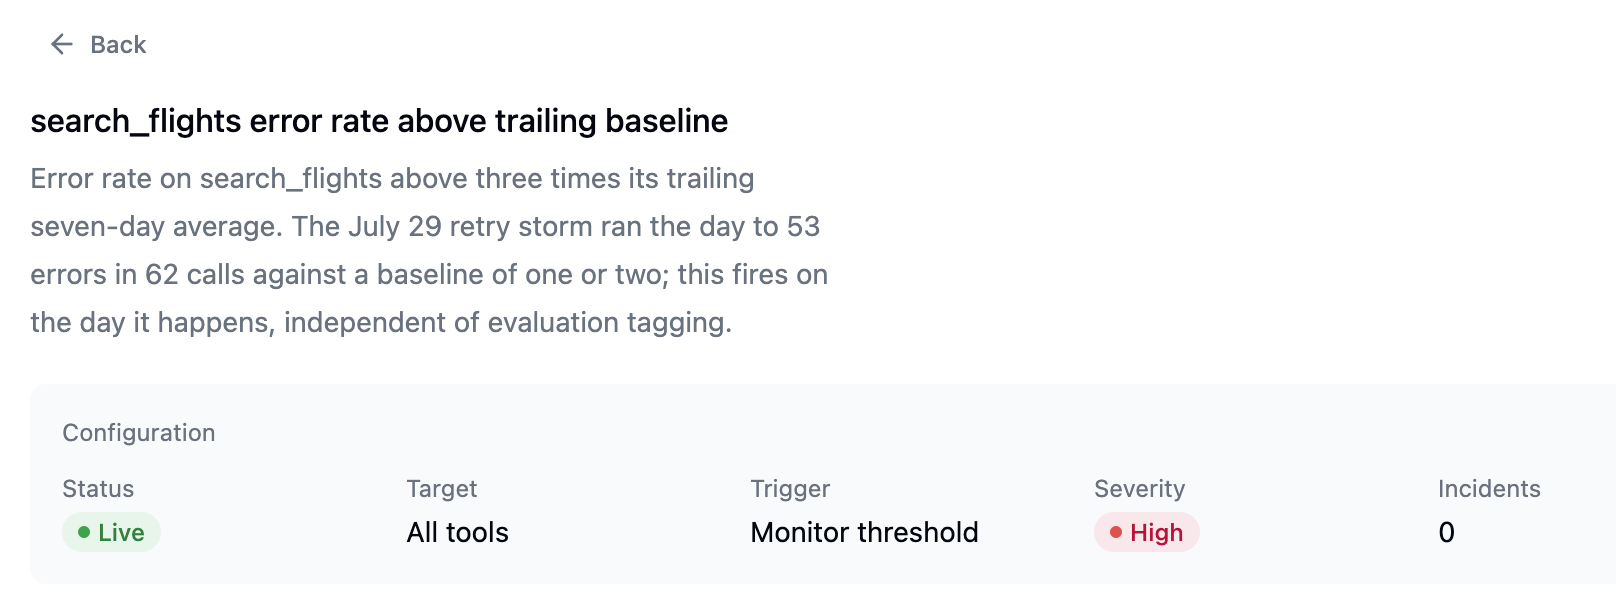
The monitor, one call to create and three weeks late.
I am mostly convinced by this, though not entirely. I knew which tool to suspect before I started looking, and a sweep across every tool in a busy project will turn up days that are merely busy sitting next to days that are broken, and telling those apart still costs somebody an afternoon. What I am sure of is narrower and I think more durable. Fifty-three errors in a day told me something had changed. One trace calling one failing tool fifteen times told me what, because a total counts the knocks while the rhythm tells you who is doing the knocking, and with agents it is so often us.