

Most LLM bugs don’t crash your app. They return 200 OKand still give the wrong answer. If I need to debug that kind of failure, I start with one thing: the complete trace.
Here’s the short version:
-
I log the exact prompt sent to the model, not just the template
-
I save raw output, parsed output, model settings, latency, token use, and prompt version
-
I review the trace in order: retrieval → prompt assembly → model output → tool calls → parser
-
I work backward to find the first span that got good input and still produced the wrong output
-
I turn each confirmed failure into a regression test
-
I track production signals like eval pass rate, schema pass rate, tool-call success rate, p95/p99 latency, and cost
A few numbers stand out. The article says 88% of agent failures in production come from monitoring and guardrail gaps, not model quality. It also notes that even at temperature = 0 , results can still vary by up to 15%. And cost spikes above 3× the 7-day rolling average can point to loops.
If I had to sum up the process in one line, it would be this: treat LLM failures like software bugs - trace them, isolate the bad step, test the fix, and keep it in a regression set.
That’s the core idea behind the full article.
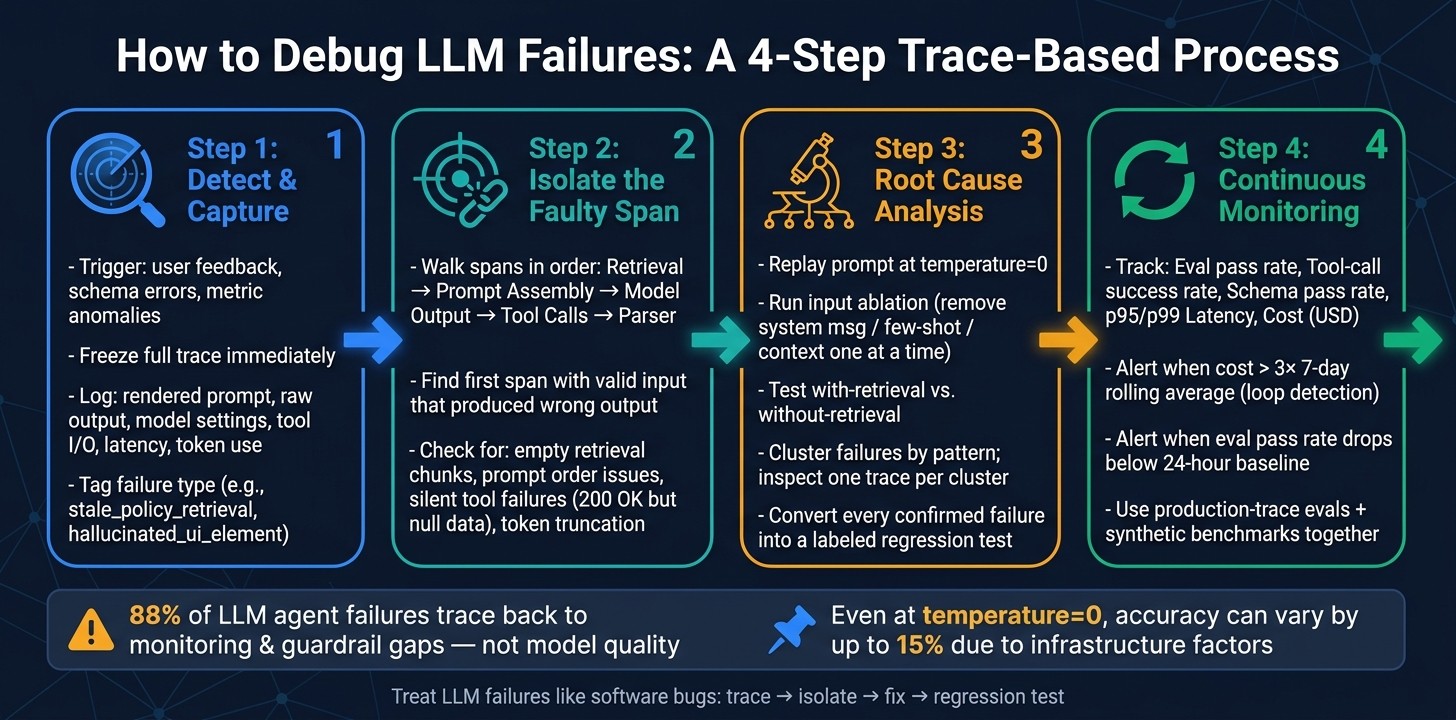
How to Debug LLM Failures: 4-Step Trace-Based Process
Step 1: Detect failures and capture the full trace
Detect failures with user feedback, rule checks, schema validation, and metric anomalies. Use each signal to catch a bad output before the request disappears. Once a signal fires, freeze the trace and go straight into span review.
As soon as a failure signal shows up, capture the full trace at once. That includes the rendered prompt, raw output, model settings, tool I/O, retrieval results, latency, and user or session metadata.
Label failures by type and save them for analysis
Unlabeled traces are tough to group or reuse. Tag each failure with a clear mode, such as stale_policy_retrieval, hallucinated_ui_element, or identity_not_disclosed.
Those labels feed your regression set and guardrails. Stick to binary pass/fail labels instead of 1–5 scales. They cut annotation drift and push clearer root-cause thinking.
How to review failed requests in observability platforms
Review the full span tree in the UI, not just the final output. Follow the execution path from retrieval through prompt assembly, model call, tool invocations, and output parsing to see where things went off track.
Here’s a habit that pays off fast: bookmark a URL template in your observability tool that pre-filters by userId and a 10-minute time window. When a user reports a problem, you can pull the right trace fast instead of digging through flat logs.
Then walk the child spans in order:
-
retrieval
-
prompt assembly
-
model output
-
tool calls
-
parser
Compare that path against a known-good trace from the same workflow. That side-by-side check makes it much easier to spot the broken span.
From there, Step 2 is isolating the faulty span.
Step 2: Inspect spans to isolate the faulty component
Once you have the full trace, work backward from the failure until you find the first span that got valid input and still produced the wrong output. That span is the actual failure point. Everything after it is usually just a downstream symptom.
This is how you shrink the problem from “the whole system broke” to “this one component broke.”
Check retrieval, prompt assembly, model output, tools, and parser in order
For each span, ask one simple question: Was the input to this component correct? If the answer is yes, the fault is in that span. If the answer is no, move one step earlier in the trace tree.
For RAG systems , start with the retrieval span. Check whether it returned no results, low-quality chunks, or pushed the best passage into the middle of a long context window where it got lost. If retrieval metrics like context recall and precision look good but the answer is still wrong, the problem likely moves upstream to prompt assembly or the model itself, not the vector database.
For prompt assembly , look for order sensitivity. Models often ignore key instructions when they’re buried in the middle of a long prompt. Few-shot examples can also send the model down the wrong path by nudging it to copy a pattern that doesn’t fit. A simple way to test this is to remove the system message, examples, or retrieved context one at a time and see what changes.
For model output , check whether the model is using the context you gave it at all. If you change an intermediate step and the final answer stays the same, that’s a red flag. It usually means the model isn’t using that step.
For agents , pay close attention to tool spans. A tool can return a 200 OK and still fail in practice by sending back empty or malformed data. That’s a silent tool failure. If tool.args_json doesn’t line up with the source input, fix the tool spec or the prompt. Also watch for loops. If you see the same tool call repeated again and again, the model was probably never told what to do when a tool comes back empty.
For formatting failures , always log the raw model output before it reaches the parser. If the raw output is valid and parsing still breaks, fix the parser. If the raw output itself is malformed, fix the prompt or the model.
There’s one more check that’s easy to miss: token truncation. It can quietly cut off key instructions in the system prompt or drop important context in the middle of a session.
A debugging table: map symptoms to likely causes
Use this table to go from symptom to first test without wasting time.
| Failure Symptom | Common Trace Signal | Likely Root Cause | First Test |
|---|---|---|---|
| Hallucination | Retrieval span shows empty or irrelevant chunks | Embedding model or chunking strategy | Did the retriever fetch the right documents? |
| Refusal | Minimal request still triggers safety response | Safety guardrail or system prompt contradiction | Does the refusal persist on a stripped-down request? |
| Parser error | Raw output is valid; parsed output is broken | Parser schema mismatch or schema complexity boundary | Does the raw output match the expected schema? |
| Silent tool failure | Tool span shows 200 OK but empty or null output |
Upstream API change or wrong tool arguments | Did the tool receive the correct parameters? |
| Stuck loop | Repeated identical tool calls in the trace | Missing escape clause or fallback on empty tool result | Does the prompt specify what to do if the tool returns nothing? |
| Context loss | Model ignores early-session instructions | Context window truncation or aggressive summarization | Is the missing instruction present in llm.input for this turn? |
| Wrong tool | Tool span name doesn’t match user intent | Ambiguous tool descriptions or goal drift | Is there a similar tool description that could have confused the model? |
Once you isolate the faulty span, Step 3 turns the trace into root-cause analysis and regression tests.
Step 3: Run root cause analysis and turn failures into evals
Once you isolate the faulty span, figure out why it failed before you patch it. That distinction matters. A one-off fix without a checked root cause has a bad habit of coming back in a slightly different shape. From there, narrow the cause with ablations and controlled reruns.
Use ablations, closed-book vs. open-book checks, and failure clustering
Replay the exact rendered prompt with temperature=0. Reruns are useful for diagnosis, but they aren’t perfectly deterministic, so treat them like a controlled test, not proof. If the failure stops showing up, randomness was probably part of the story. If it still shows up, you now have a stable case you can keep tracing.
Next, run input ablation. Remove one prompt element at a time - the system message, few-shot examples, or retrieved context - and rerun after each change. This helps you see which part is doing the damage.
It also helps to pair that with a with-retrieval vs. without-retrieval test. Run the same query with retrieval context, then run it again without that context. If the model gets the answer right without context but fails with it, the issue is in retrieval, not in the model’s reasoning.
When you’re dealing with more than one failure, don’t chase each one from scratch. Group them by failure pattern first, then inspect one representative trace per cluster. Once the pattern is clear, compare it with a known-good trace or turn it into a regression case.
Manual debugging vs. platform-assisted workflows: pros and cons
After you identify the root cause, pick the fastest workflow you can repeat the next time this happens. Manual debugging can work in early-stage projects or for one-off incidents. But at scale, platform-assisted workflows usually cut investigation time by a lot.
| Feature | Manual | Platform-Assisted |
|---|---|---|
| Speed | Slow | Fast, with structured playbooks |
| Consistency | Low; varies by engineer | High; standardized scorers and taxonomies |
| Regression creation | Manual test case creation | Trace-to-dataset promotion |
Build regression sets and guardrails from real failures
Every confirmed failure should become a test case, not a note lost in a Slack thread. Save the input, the context, the expected behavior, and a clear failure label. Skip vague labels like incorrect_answer. Use labels like stale_policy_retrieval or hallucinated_tool_argument so the regression set tells you what actually went wrong.
Latitude turns confirmed production failures into evals and regression tests, and pins model versions so results stay reproducible. Those cases then feed the continuous debugging loop in the next step.
Step 4: Set up a continuous debugging loop
Use production traces, alerts, and evals to make debugging a steady habit, not a one-time cleanup. The regression cases from Step 3 should now do double duty: they help you watch live traffic and spot drift before it turns into a bigger mess.
Metrics to track in production
Track these six metrics in production.
| Metric | What It Catches | Priority |
|---|---|---|
| Failure rate by cluster | Percentage of traces failing due to specific root causes (e.g., tool_misuse); inspect repeated root causes |
Critical |
| Eval pass rate | Percentage of production samples passing automated or human-in-the-loop checks | High |
| Latency (p95/p99) | Time to complete the full request; includes time to first token | High |
| Tool-call success rate | Frequency of tools returning valid data vs. errors or empty results; inspect tool spans | High |
| Schema pass rate | Percentage of outputs that successfully parse against expected structures (e.g., JSON/Zod); inspect parser spans | High |
| Token usage & cost (USD) | Input/output tokens and total USD cost per request or session | Medium |
Set alerts on all critical and high-priority metrics. Cost needs its own tripwire too: trigger an alert when spend per tenant goes above 3× the 7-day rolling average. That often points to a recursion loop.
Quality drift needs similar guardrails. Alert when your eval pass rate drops below the 24-hour baseline. Also keep an eye on distribution shifts. For example, if non-ASCII characters start showing up in English responses, that can hint at a silent provider quality shift.
These alerts should feed back into the same trace-review loop from Steps 1–3.
Synthetic benchmarks vs. production-trace-based evals
Use synthetic tests for the cases you know about. Then check production traces to find the ones you didn’t see coming.
Synthetic benchmarks help before deployment, but they top out fast. They only test failure modes you already guessed might happen. Production-trace evals are different. They show what users actually did, where the system bent, and where it broke.
| Feature | Synthetic Benchmarks | Production-Trace Evals |
|---|---|---|
| Realism | Low; based on assumed inputs | High; reflects actual user behavior |
| Edge-case coverage | Limited to known unknowns | High; captures unanticipated failures |
| Maintenance cost | Low initially, grows with product changes | Ongoing; traces need labeling and review |
| Tool support | Standard across all platforms | Specialized in Latitude, LangSmith, Braintrust |
In practice, you want both.
-
Use a golden set of at least 20 manually labeled production failures on every prompt change to catch regressions before deployment.
-
Let synthetic benchmarks cover the happy path.
-
Let production-trace evals cover the weird stuff that tends to break in production.
If you want stable comparisons while debugging, pin model versions. Even with temperature=0, accuracy variance can still hit 15% because of infrastructure factors like continuous batching and floating-point ordering.
Conclusion: Treat LLM failures like software bugs
Reliable LLM systems close the loop: observe failures, inspect traces, analyze root causes, and turn real incidents into regression tests.
That means four parts need to work together: observability to surface failures when they happen, trace inspection to guide the investigation, systematic root cause analysis to stop patching surface symptoms, and regression tests built from real failures so the same bug doesn’t show up again.
88% of LLM agent failures in production trace back to infrastructure gaps - missing guardrails and inadequate monitoring - not model quality. That’s a big deal. It means most reliability problems can be fixed with a better process, not just a different model.
Traces, labels, evals, and continuous monitoring aren’t separate pieces sitting on a shelf. They’re one loop. And that loop only works when all four are in place.
FAQs
How do I know which span caused the failure?
Use distributed tracing, then walk the span tree for the failing trace in order. Check each span’s input prompt, output, and metadata like latency, tokens, model, and errors.
Most of the time, the bad step comes down to one span : wrong retrieval chunks, bad tool-call arguments, an LLM hallucination, or a timeout/error. Don’t change code until you’ve pinned down that span.
What should I log to debug LLM failures effectively?
Log more than the usual app events. Store the raw user query, the final prompt after templating, and the unedited model response.
For agent workflows, log the full trail too: tool names, inputs, raw results, latency, HTTP status codes, errors, model version, sampling settings, token counts, and trace IDs. If it fits your setup, Latitude can help spot these failure modes, track them as bugs, and turn production issues into evals.
How can I turn production failures into regression tests?
Capture the full production trace - inputs, outputs, tool calls, and any retrieved context - so you preserve the failure exactly as it happened. That raw trace matters. Without it, you’re often left guessing what went wrong. Tools like Latitude can help bring those failures to the surface, keep track of them, and generate evaluations.
Then move from “we saw a bug” to “we can stop it from happening again.” Diagnose the behavior and label it. Add the trace to a versioned regression dataset. Write a scorer that flags the issue. Run that scorer in CI so the regression gets caught before deployment.