

Your AI can pass launch checks and still get worse fast. By March 2026 , Gartner reported that 67% of enterprise LLM deployments showed measurable drift within 90 days. So if you only test before launch, you’re leaving a big gap.
Here’s the short version: I’d treat drift detection as a live system, not a one-time task. That means I’d watch input shift , output quality , latency , cost , refusal rate , and tool-call success at the same time. I’d also set a baseline from live traffic, score only a sample of traces, and define what happens when alerts fire: observe, investigate, or act.
If I had to boil the article down into a few points, it would be this:
-
Launch metrics are not enough. User behavior, prompts, retrieval data, and provider updates can change system behavior after release.
-
LLM regressions are hard to spot. The app may still “work” while answer quality, safety, or cost slips.
-
There are 3 main drift types:
-
Data drift: inputs change
-
Model drift: the system changes
-
Concept drift: the correct answer changes
-
-
Top-line averages can hide bad slices. One prompt, model route, or customer segment may be failing while the dashboard looks fine.
-
Good monitoring uses layers. Start with a baseline, monitor live traces, then tie alerts to a fixed response path.
-
Cheap checks should run first. Metrics like PSI , KS , KL divergence , or embedding distance can flag trouble before you spend money on deeper scoring.
-
Segment-level tracking matters. Slice by model version , prompt variant , task type , and customer segment.
-
Goodput is a strong roll-up metric. I’d track the share of requests that meet all SLOs at once, not each metric in isolation.
-
Tool choice depends on the job. Some tools are better for tracing, some for eval gating, and some for turning production failures into repeatable evals.
A few numbers stand out from the article:
-
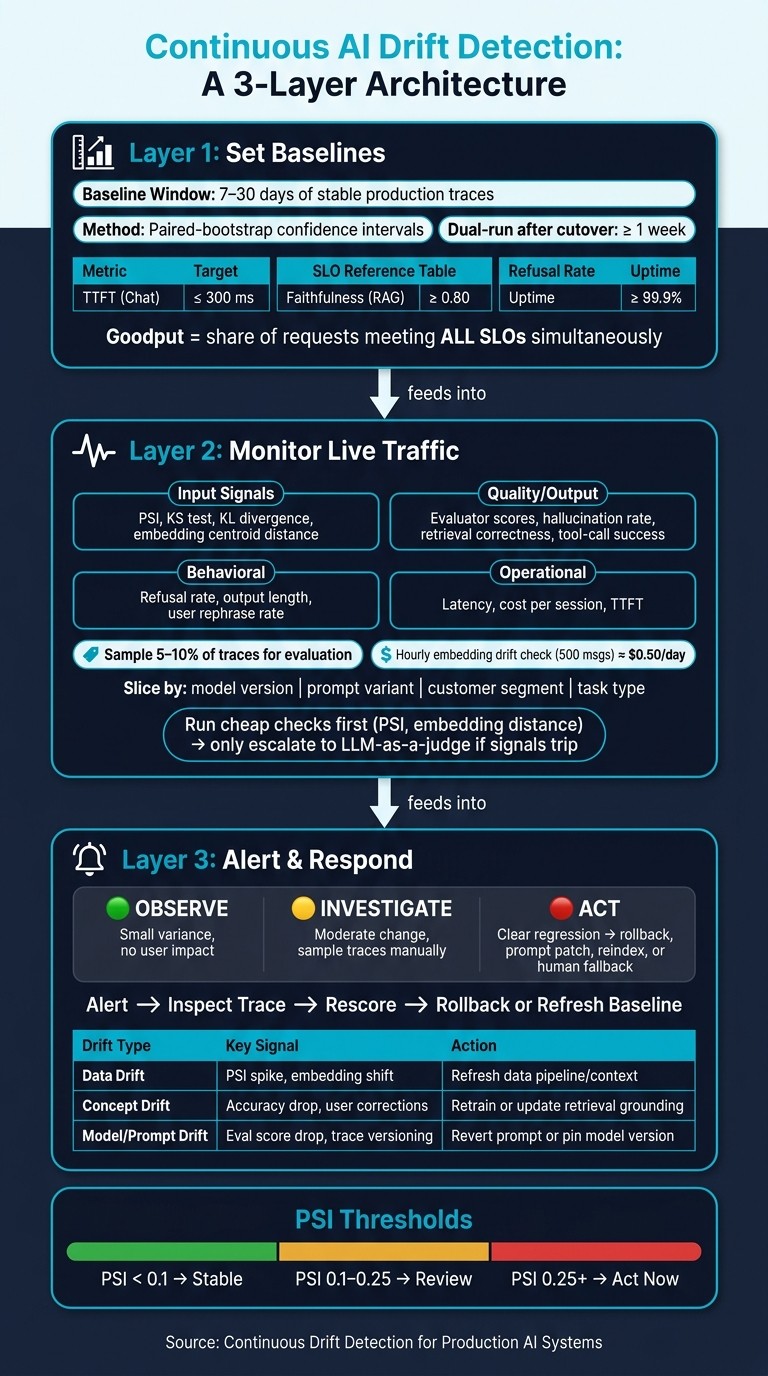
PSI < 0.1: stable
-
PSI 0.1–0.25: review
-
PSI 0.25+: take action
-
Trace sampling:5%–10%
-
Baseline window:7–30 days
-
Post-cutover dual run: at least 1 week
-
Example SLOs: TTFT ≤ 300 ms , faithfulness ≥ 0.80 , refusal rate ≤ 2% , uptime ≥ 99.9%
One point I like here is simple: don’t wait for user complaints. If drift detection is set up well, you can catch small shifts in quality, cost, or behavior before they turn into support tickets, lost revenue, or bad answers at scale.
That’s the core idea the article walks through: how I’d build a simple loop of baseline → detect → review → respond so AI regressions don’t sit in production for weeks.
How Drift Causes AI Regressions
Data drift, model drift, and concept drift in plain production terms
In production, AI quality usually slips in three main ways.
Data drift happens when the inputs your system sees no longer look like the data it was built and tested on. In plain terms, users start asking about new topics, their intent shifts, or the way they write changes. The model stays the same, but the traffic changes.
Model drift is different. Here, the behavior changes because the system changed. Maybe the provider updated the model without much notice. Maybe someone edited the prompt template. Maybe the retrieval index got rebuilt. GPT-4’s accuracy on a prime-number task fell from 84% to 51% without a version change. That’s model drift in the wild. In logs, you’ll often see it as a shift in output length or a drop in evaluator scores tied to one model version or one prompt revision.
Concept drift is the hardest one to spot. The inputs can look statistically normal, but the right answer has changed because the world changed. A policy update is a good example. An answer that used to be correct can turn wrong overnight, not because the prompt changed, but because the underlying truth changed. In evals, this often shows up as lower retrieval correctness or faithfulness scores even when input stats still look fine.
Detection signals teams should track continuously
You want to watch drift across inputs, outputs, and system health.
| Signal Category | What to Track |
|---|---|
| Input | PSI, KS test, KL divergence, embedding centroid distance |
| Quality (Output) | Evaluator score trends, hallucination rate, retrieval correctness, tool-call success rate |
| Behavioral | Refusal rate, output length distribution, user rephrase rate |
| Operational | Latency, cost per session, TTFT |
For PSI, below 0.1 is stable, 0.1–0.25 needs review, and 0.25+ calls for immediate action.
A smart way to handle this is to run cheap statistical checks like PSI and embedding centroid distance all the time. Then, only if those signals trip, run the more expensive LLM-as-a-judge re-scoring. That keeps watch costs under control without flying blind.
What silent LLM regressions look like in production
This is where things get sneaky.
Your top-line metrics can look fine while one slice of traffic is getting worse answers. Latency may stay normal. Response rate may stay normal. Meanwhile, quality drops for one routing cohort and nobody notices at first.
Anthropic’s Claude ran into this exact kind of masked regression in August 2025. Three overlapping bugs - a routing error, a TPU misconfiguration that injected Thai characters into English responses, and a compiler bug - led to degraded outputs for six weeks. Standard benchmarks missed the issue because the model often recovered from isolated mistakes. That kept aggregate metrics looking healthy while some routing cohorts kept getting poor results.
That’s why teams need to watch the tail, not just the average. p5 quality scores often show regressions before the median moves.
Once those signals start to shift, the next step is baselines, live traces, and automated evaluators.
A Practical Architecture for Continuous Drift Detection
AI Drift Detection Loop: Baseline → Detect → Review → Respond
The answer comes down to three layers: baselines, live monitoring, and alerting tied to a clear response path.
Layer 1: Set baselines before and during rollout
Before rollout, build a 7–30 day baseline from stable production traces. Use that baseline to calculate score distributions and embedding centroids for later comparison. When you compare a new rollout against it, use paired-bootstrap confidence intervals instead of plain averages.
Start with these production SLOs:
| Metric | Target (p95) |
|---|---|
| Time to First Token (TTFT) - Chat | ≤ 300 ms |
| Faithfulness Score (RAG) | ≥ 0.80 |
| Refusal Rate | ≤ 2% |
| Uptime | ≥ 99.9% |
One metric that deserves more attention is goodput - the share of requests that hit all SLOs at the same time. A system can look fine when you check each metric on its own, while goodput quietly falls apart.
Of course, a baseline is only useful if live traces keep feeding back into it.
Layer 2: Monitor live traffic with traces, sampling, and evaluators
Capture full traces with OpenTelemetryGenAI conventions , then sample 5–10% for evaluation. Use low-cost statistical checks to decide when to run more expensive rescoring. As a reference point, an hourly embedding-drift check that samples 500 messages with text-embedding-3-large costs about $0.50 per day.
Don’t stop at top-line averages. Alert on segment-level shifts by slicing each metric by:
-
model version
-
prompt variant
-
customer segment
-
task type
That matters because a regression that hits only one slice of users may disappear in the overall average, but it will stand out once you break the data apart. Canva’s AI team uses Langfuse’s hierarchical traces and evaluation features to monitor generative production AI traffic at scale.
Layer 3: Alert, review, and trigger rollback or retraining
When signals move, monitoring needs to turn into action. Alert on combinations of signals , not just one metric in isolation. If you see embedding shift, a drop in quality scores, and a behavior change like higher refusal rates at the same time, that’s a much stronger sign that something is wrong - and it also helps narrow the cause.
Set the response before the alert ever fires. Use three response tiers: observe, investigate, act. That can mean rollback, a prompt patch, retriever reindexing, or switching to a human-only fallback. Once an alert fires, follow this path: alert → inspect trace → rescore → rollback or refresh baseline. And when you do a model cutover, keep a dual-run window for at least one week after launch so you can catch slow drift patterns that canary deploys often miss.
In April 2026, CallSphere added “concise” to a prompt, skipped booking confirmations, and cut booking revenue 11% in a week.
Use these signals to decide what to do next:
| Drift Type | Detection Signal | Action |
|---|---|---|
| Data Drift | PSI scores, null-rate spikes, embedding centroid distance | Investigate data pipeline / refresh context |
| Concept Drift | Accuracy decline, user correction pressure, proxy metrics | Retrain model or update retrieval grounding |
| Prompt- or model-driven drift | Trace-level versioning, eval score drops, behavioral diffs | Revert prompt, pin model version, or fix tools |
Tools for LLM Observability and Drift Detection
What to look for in a production drift detection stack
Once you’ve defined the detection loop, the next step is simple: pick the tools that can support it in production.
A production drift detection stack should do more than log prompts and outputs. It needs tracing, version tracking, eval workflows, golden-set comparisons, and alerts tied to a clear next step. It also needs annotation queues and CI/CD gating, so drift detection doesn’t stop at finding problems. It helps stop them before they ship.
Where Langfuse, LangSmith, Braintrust, Helicone, and Latitude fit
Each tool covers a different part of regression prevention. Some are stronger at tracing. Others focus on evaluation, gating, or turning production issues into evals. The right setup depends on what your team needs most: tracing, eval gating, fast setup, or a tight loop from production failures back into testing.
| Tool | Core Strength | Best-Fit Use Case | Best fit for drift detection |
|---|---|---|---|
| Langfuse | OpenTelemetry-native, self-hostable tracing | Teams that need data ownership and framework-agnostic tracing | Strong |
| LangSmith | LangChain/LangGraph debugging | Teams already invested in the LangChain ecosystem | Strong |
| Braintrust | Eval-first CI/CD gating | Teams that want eval regressions to block merges automatically | Best for CI/CD gating |
| Helicone | Fast proxy-based traffic capture | Teams that want simple observability and cost tracking without much instrumentation | Good for lightweight capture, weaker for deep eval workflows |
| Latitude | Turns production failures into tracked issues, auto-generates evals from real production issues, and measures eval quality over time with alignment metrics | Teams that want real production failures turned into reusable evals, not just logged incidents | Strong |
Latitude takes a practical angle: it turns real production failures into evals, then feeds human review back into the loop so coverage grows from regressions your team has actually seen.
When to pair LLM observability tools with broader ML monitoring platforms
LLM-native tools can cover a lot of ground, but they don’t cover everything.
If your system also includes tabular models, batch pipelines, or feature stores, it makes sense to pair your LLM observability layer with a platform like Evidently AI, WhyLabs, or Amazon SageMaker Model Monitor. Those tools are better suited for feature drift, schema validation, and data-quality checks. The same goes for teams that need broader infrastructure correlation or enterprise compliance. Datadog and New Relic are a better fit when you need to connect LLM behavior with CPU and latency metrics, or when you need to meet requirements such as FedRAMP.
A common setup uses two layers: a lightweight proxy like Helicone for traffic capture, paired with a deeper instrumentation platform like Langfuse or Braintrust for evals and regression gating, with a standard ML monitor underneath when the AI system is just one part of a larger pipeline.
Once the tooling is in place, the operating model matters more than the product list. Use these tools to support a repeatable rhythm: baseline, detect, review, act.
Preventing Regressions: Operating Model and Key Takeaways
A repeatable workflow for prevention, not just detection
Once tracing and evaluators are set up, the last step is the response loop. Detection without a plan is just noise. Teams that stop regressions well treat drift signals as a cue to act, not just something to log.
That workflow should be spelled out before any rollout starts. Run offline regression checks against your golden set before a change ships. Then run shadow traffic tests on production traffic before a full rollout. After that, deploy to a small canary slice, usually around 1% , and keep the prior version ready in case the canary window shows degradation. Before promotion, run a paired-bootstrap confidence interval test. If any segment’s confidence interval stays below zero, block the release.
Once the change is live, sort drift signals into three tiers:
-
Observe for small variance with no user impact
-
Investigate for moderate change that needs sampling and manual trace review
-
Act for clear regressions that call for rollback or a prompt fix
Each alert should already point to a specific response before it ever fires. That way, nobody is scrambling when a signal shows up.
Use fixed review cadences too. Continuous monitoring handles live signals. Monthly scorecards compare performance against the last stable 30-day window. Quarterly reviews refresh golden sets and evaluator rubrics, because static tests get stale as user behavior shifts.
Key points to leave with your team
The team’s job isn’t to detect drift one time. It’s to make the response almost automatic. Launch evals give you a baseline, not a promise.
Track latency, quality, safety, cost, refusal rate, and tool-call frequency together. Use goodput as the roll-up metric: the share of requests that meet all SLOs at the same time across latency, quality, and cost. That one number gives you a plain read on whether the system is holding up across the whole stack, not just in isolated metrics.
FAQs
How do I know which type of drift is happening?
Monitor three signal classes against a stable, versioned reference window:
-
Input distribution drift : embedding distances
-
Output distribution drift : response length, structure, tone, or refusal rates
-
Eval-score drift : rolling-mean rubric scores on production traces
When these signals don’t line up, the mismatch usually tells you something useful. For example, if eval scores stay flat but user complaints start climbing, that often points to a shift in the kinds of inputs the system is getting.
Don’t stop at top-line metrics. Slice the data by cluster or category so you can spot changes that get buried in the aggregate.
What should I monitor first if I have limited resources?
Start with request-level tracing and simple scheduled evaluations, not continuous automated monitoring. That gives you a clean way to see what happened when something goes wrong.
Capture:
-
Prompts
-
Model versions
-
Tool calls
-
Latency
With that in place, you can debug issues when they happen instead of guessing.
Then re-run a small, versioned golden set each day or week. For active monitoring, stick with high-signal metrics first, like error rates and cost per run , before you pile on more complex drift signals.
When should drift trigger a rollback instead of a review?
Drift should trigger a rollback when it causes a clear regression that breaks pre-defined safety or performance thresholds. Small shifts might only need a review. But if toxicity jumps or your regression budget is exceeded, you should roll back right away.
A rollback also makes sense when a specific change - like a model update or prompt edit - leads to a verified drop in output quality or reliability.